Bloomberg Terminal Alternative for Professionals Accountable for Results

Request a Zoom Demo →

The Bloomberg Terminal costs $31,980 a year and leaves the trading to you. Price Action Pivoter™ V5Ai Suite is a lifetime license that selects the strongest competing machine-learning model, checks the news through Gemini in real time, and trades CME futures to the risk and reward objectives you set. Built by an NFA-registered CTA. Check in when you want to; you do not have to sit in front of the screens.

CFTC Registered Commodity Trading Advisor NFA #0516752

300+licensed clients worldwide
Lifetimeone payment, no renewal
Since 2018registered CTA, Algorithmic Systems Developer
Intelligent Automationmultivariate LSTM and real-time news models

Side by side

$31,980 a Year for Information vs. One Payment for Automation, News Intelligence and Execution

The terminal is an information product: you read it, form the view, size the trade, place the order and manage the stop. Price Action Pivoter™ V5Ai Suite is an execution product: it does those steps for you, on your account, inside NinjaTrader 8.

What you pay
Bloomberg Terminal (single seat)

$31,980 per yearAbout $2,665 a month for a single seat, $28,320 per seat with two or more. Two-year minimum contract, billed quarterly or semi-annually, no month-to-month option. Setup and hardware delivery is reported at $500 to $1,500 per terminal, and real-time depth data for specific exchanges adds pass-through fees on top.

Price Action Pivoter™ V5Ai Suite

$34,195, once, for a lifetime licenseTrade up to 15 contracts per leg, and scale in up to 3 additional legs, each up to 15 contracts. Need more contracts? Purchase 15-contract lots at only $5,000 each. The current offer date is posted under each price below.

What it costs to automate
Bloomberg Terminal (single seat)

The desktop API included with the seat is for personal analysis only and is barred from feeding automated order routing. Piping real-time data into a trading engine requires the B-PIPE enterprise feed, reported at $2,000 to $3,000 or more per month, and server-side backtesting requires a separate Data License reported at $10,000 to $50,000 or more per year. A one-seat quant setup is commonly reported at $55,000 to $90,000 a year all in.

Price Action Pivoter™ V5Ai Suite

Market data from your broker and your own Google Gemini API key on Google’s pay-as-you-go pricing. Trading through NinjaTrader Brokerage, the NinjaTrader 8 platform is included at no charge; trading through Interactive Brokers requires the NinjaTrader Multi-Broker license at $99 per month. Automation, signals, news checking and execution are all inside the lifetime license.

What the money buys
Bloomberg Terminal (single seat)

Real-time and historical data across asset classes, news, charting, screening, analytics and the Bloomberg messaging network. Every trading decision remains yours.

Price Action Pivoter™ V5Ai Suite

A fully automated trading system that runs multiple multivariate LSTM models that compete to pick the top ML model, checks the news via Gemini’s API in real time, manages the trade entries, exits, trailing stops (various kinds), stop and profit target, scales additional trades each with their own trailing stops, stops and profit targets, and provides you with several tiers of money management including high-watermark protection.

Order execution
Bloomberg Terminal (single seat)

Execution tools are built for institutional desks. As an individual or small firm you route orders through your own broker’s platform and enter them by hand.

Price Action Pivoter™ V5Ai Suite

Hands-free and fully automated using your risk/reward objectives. Connects through NinjaTrader Brokerage, or through Interactive Brokers with a NinjaTrader Multi-Broker license ($99 per month).

News
Bloomberg Terminal (single seat)

A continuous headline feed. You decide in real time what matters to your position and whether to act.

Price Action Pivoter™ V5Ai Suite

PQNews™ 2.0 retrieves headline, breaking, and scheduled market news through Google Gemini (requires Gemini API key), scores it 0 to 10, and vetoes the trade direction that conflicts with the news. The veto is released only after price confirms the market has absorbed the news. When news supports the trade, PQNews™ releases the trade direction’s veto.

Signals
Bloomberg Terminal (single seat)

Charts, screens and alerts you build and maintain yourself. The terminal does not tell you when to go long or short.

Price Action Pivoter™ V5Ai Suite

HigherEdgeAI™ 3.0 evaluates 360 engineered features per market bar across rolling 30-bar sequences. Three candidate models are trained and internally backtested each cycle and the strongest is selected. You set the confidence threshold, 60% to 90%.

Risk management on your account
Bloomberg Terminal (single seat)

None. Risk controls are whatever you configure at your broker.

Price Action Pivoter™ V5Ai Suite

Custom trailing stops, per-leg profit locks, session high-watermark protection, near-exit profit lock, consecutive-loss switch, net session profit and loss limits, maximum trades per session, and a protective-stop safety buffer. Multiple stop systems run at once and the most protective stop wins.

Markets
Bloomberg Terminal (single seat)

Every asset class, worldwide. Breadth you pay for whether you use it or not.

Price Action Pivoter™ V5Ai Suite

Nearly any futures contract with at least 22.5 hours of data per session: ES, NQ, GC, CL, FDAX, SI, NG, 6E, 6B, HG and their micros. Built and backtested on CME index futures, where liquidity is deepest and tax treatment is most favorable.

Who built it
Bloomberg Terminal (single seat)

A financial data vendor serving banks, funds and corporations.

Price Action Pivoter™ V5Ai Suite

Former money manager.

Commitment
Bloomberg Terminal (single seat)

Two-year contract, billed in advance, price rises at renewal.

Price Action Pivoter™ V5Ai Suite

Pay once. 

Bloomberg Terminal figures are the 2026 single-seat list price and add-on ranges as reported by multiple industry sources. Bloomberg L.P. does not publish a public price list; contract terms vary.

Who trades it

Built for the professional who is paid on results, not on hours in front of a screen

Most terminal subscribers are paid to find trades in the data. If you are paid on what the trades return, the terminal is a cost center and the Price Action Pivoter™ V5Ai Suite is the desk.

CTAs and CPOsRun the Suite inside your trading program and describe it in your Disclosure Document like any other component of your approach. Mach 16 covers financial-advisor accounts; add 15-contract lots at $5,000 each as your book grows.
Family offices and exempt managersAdvisers exempt under CFTC Regulation 4.14(a)(10), and family offices, can trade client and family accounts through one Interactive Brokers master account, with fills allocated to sub-accounts under your own allocation method.
RIAs and independent professionalsTrade a futures sleeve for clients where your registration permits it, or run your own capital alongside a managed book. Former floor traders, market makers and brokers already trade this Suite on their own accounts.

You do not need to sit in front of the monitors all session. Check in periodically. The Suite enters, manages and exits positions according to the profit and risk parameters you set.

You remain responsible for your own registration, disclosure and trade-allocation obligations; the license does not change them.

Why futures

The Price Action Pivoter™ V5Ai Suite can trade stocks. It chooses CME futures, and here is why.

Most Bloomberg Terminal subscribers trade equities. Price Action Pivoter™ V5Ai Suite is capable of trading stocks; it trades CME futures by choice, because the rules that govern stocks cost you money and flexibility that a futures trader never gives up.

Tax treatment
Trading stocks

Gains on positions held under one year are taxed as ordinary income at your top marginal rate. The wash-sale rule can disallow losses you actually took.

Trading CME futures

Section 1256, the 60/40 rule. 60% of gains are taxed as long-term and 40% as short-term regardless of holding period, even on a trade held minutes. Positions are marked to market at year end and reported on one form. The wash-sale rule does not apply.

Pattern Day Trader rule
Trading stocks

With under $25,000 in a margin account you are limited to three day trades in any five business days.

Trading CME futures

No Pattern Day Trader rule. Trade as often as the Suite signals.

Capital required
Trading stocks

Regulation T: 50% of position value up front, 4:1 intraday only if you qualify as a pattern day trader.

Trading CME futures

The exchange performance bond is a fraction of contract value, and intraday margins set by your broker are lower still. Less capital controls more market exposure. Leverage magnifies losses as well as gains, which is why the Suite’s stop and money-management controls exist.

Going short
Trading stocks

You must locate shares to borrow, pay borrow fees, and hard-to-borrow names may be unavailable. Short-sale restrictions can block entries on a down day.

Trading CME futures

Selling short is identical to buying long: same order, same margin, no borrow, no fee, no restriction.

Trading hours
Trading stocks

One 6.5-hour regular session. Pre- and post-market volume is thin and spreads widen.

Trading CME futures

Nearly 23 hours a day, Sunday evening through Friday afternoon, with one daily maintenance break. You choose the days and hours the Suite is allowed to trade.

Liquidity
Trading stocks

Varies by name. Spreads and depth change with each ticker and each session.

Trading CME futures

The E-mini S&P 500 is one of the most heavily traded contracts in the world, with a one-tick spread most of the session and depth that absorbs size without slippage.

Single-company risk
Trading stocks

Earnings, guidance, downgrades, halts, dividends, splits and management news can move one stock 10% to 30% overnight.

Trading CME futures

One index contract represents the whole index. No earnings gaps on a single name, no dividends to track, no corporate actions, no halts.

What you have to follow
Trading stocks

Thousands of tickers, each with its own news flow, calendar and chart.

Trading CME futures

A handful of contracts. The Suite watches the price action and PQNews™ 2.0 watches the headlines that move the market.

Position sizing
Trading stocks

Sized in shares; scaling in or out means more commissions and more borrow on the short side.

Trading CME futures

Micro contracts (MES, MNQ, MCL, MGC) are one-tenth the size of the full contract, so you scale from one micro to full-size contracts with the same Suite and the same settings.

Settlement
Trading stocks

T+1 settlement; proceeds from a sale are not available to redeploy until the next day.

Trading CME futures

Daily cash settlement. Profits and losses post to your account every night.

Tax information is general and is not tax advice. Section 1256 treatment applies to regulated futures contracts under U.S. federal tax law; consult your tax professional about your own situation.

Hypothetical performance

Thirty-two months of backtests, published in full, trade by trade

January 1, 2024 through August 24, 2026, Regular Trading Hours only, one-minute bars calculated on bar close, two ticks of slippage, commissions excluded, core parameters held constant for the entire period. HigherEdgeAI™ 3.0 training objectives were selected automatically by PinnacleQuantRangeTracker™. Every run includes the HigherEdgeAI™ signal files, a trade-by-trade file and the dashboard PDF with the exact parameters, so you can rebuild it yourself in NinjaTrader’s Strategy Analyzer. Not curve-fitted; no Renko or Heiken-Ashi bars.

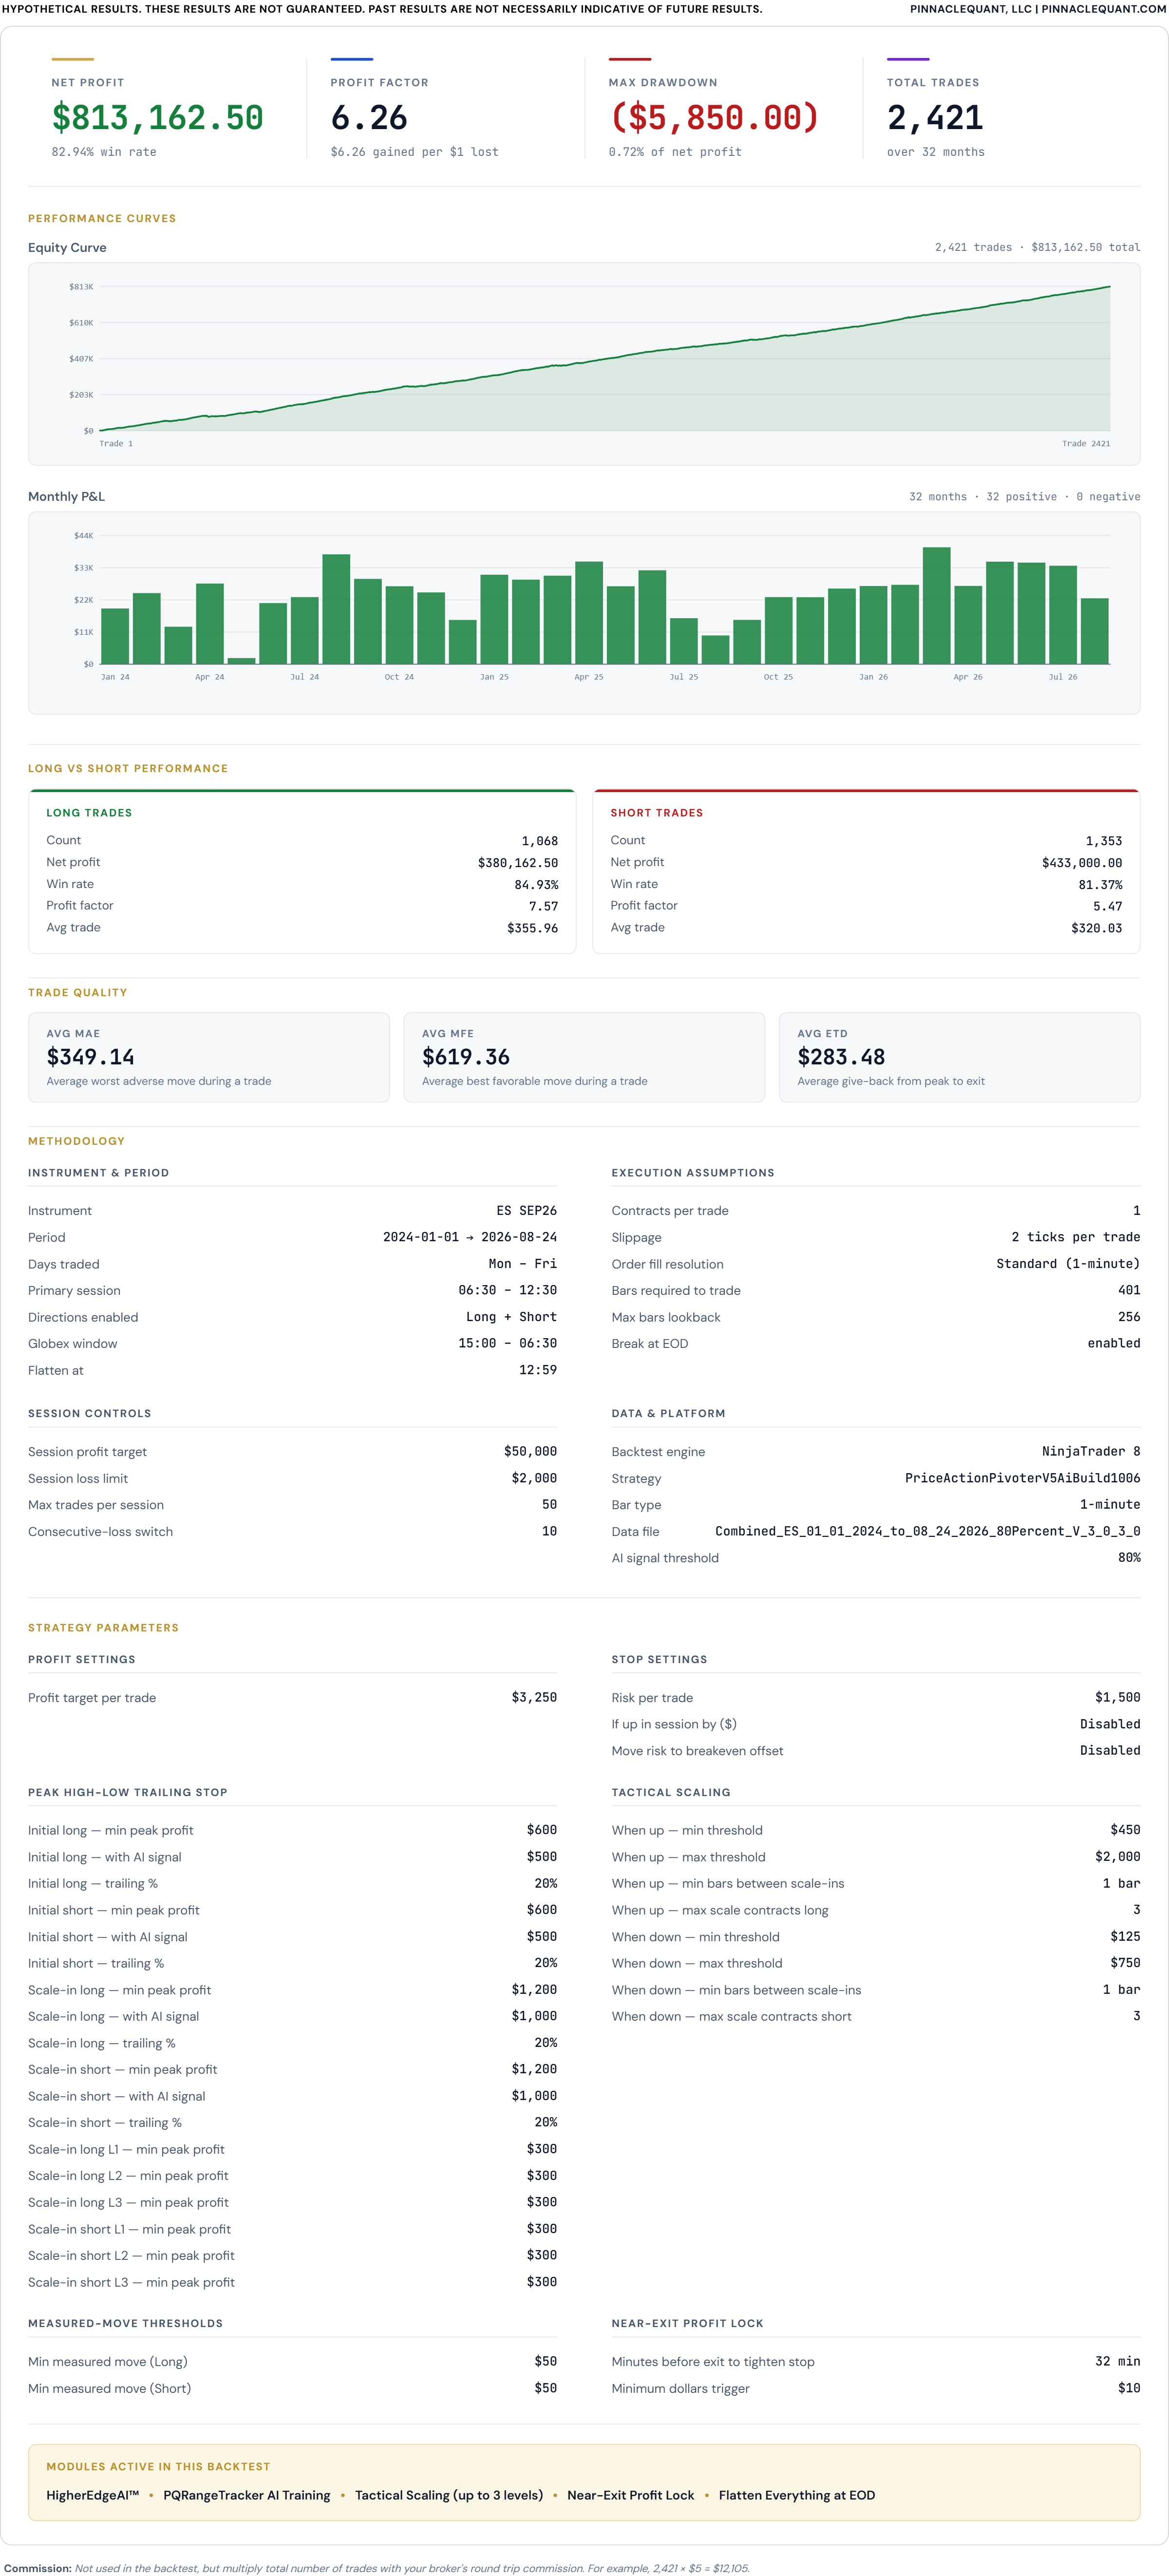
Backtest 1 · ES · 1 Contract · 80% HigherEdgeAI™ 3.0 confidence
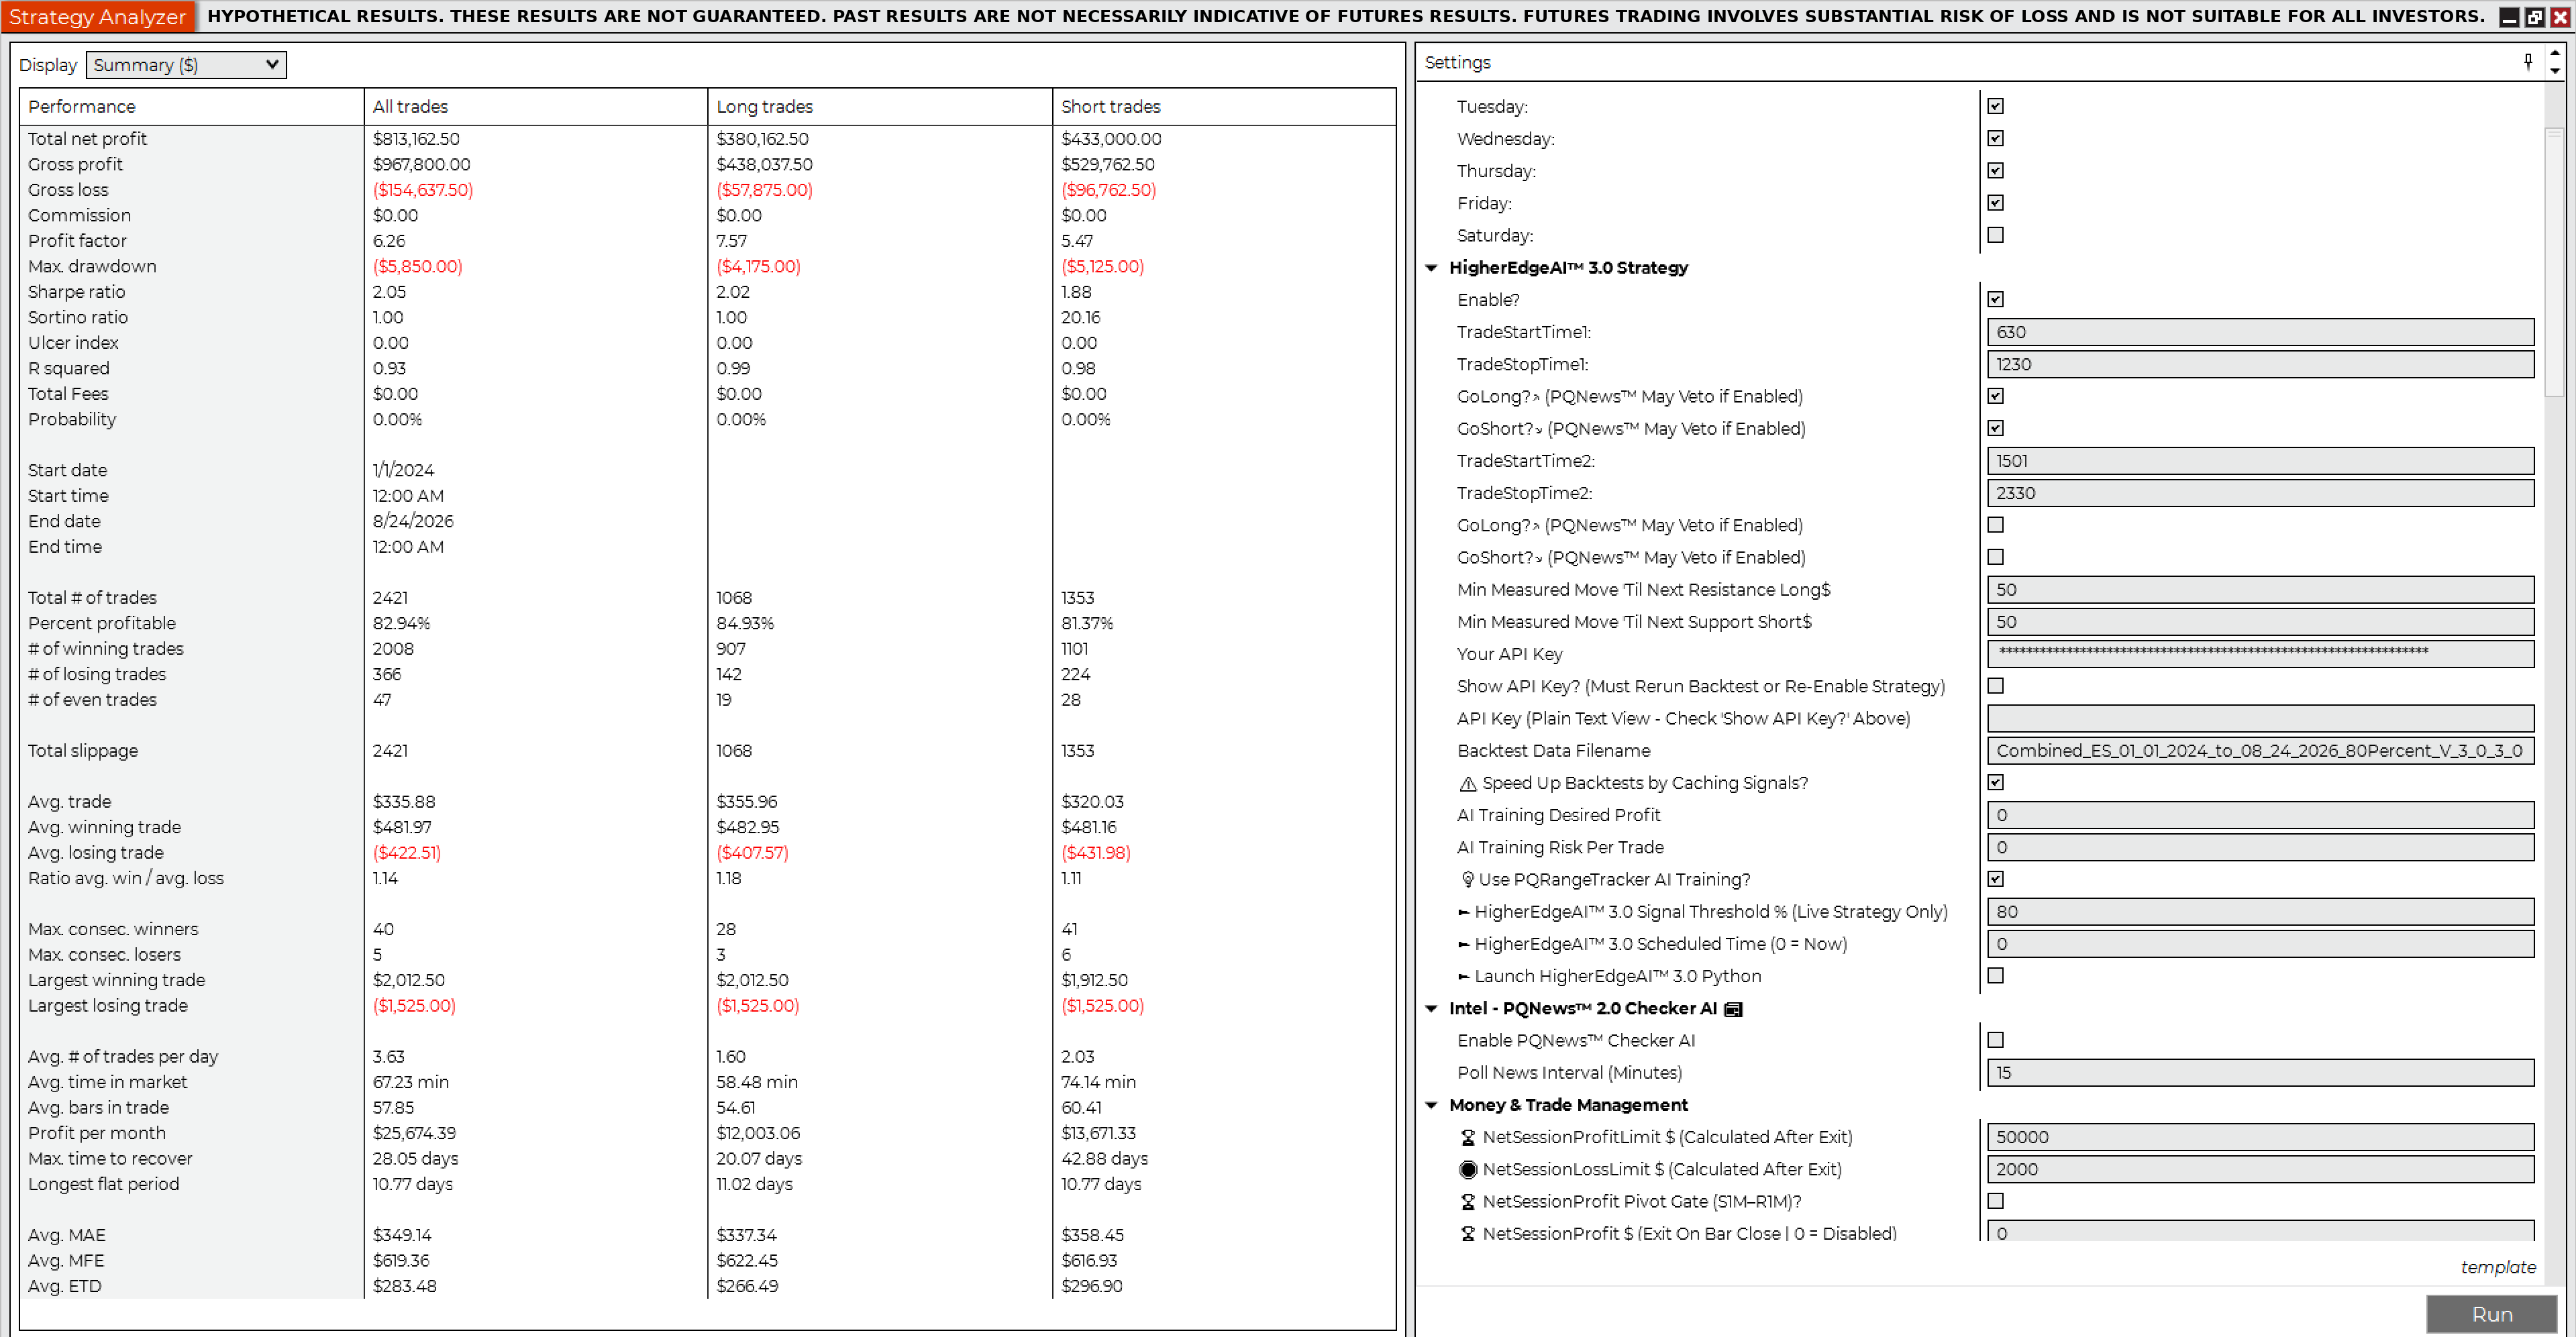
Net profit $813,162.50
Gross profit$967,800.00
Gross loss($154,637.50)
Profit factor6.26
Max drawdown($5,850.00)
Trades2,421
Win rate82.94%
Winning trades2,008
Losing trades366
Sharpe ratio2.05
Sortino ratio1.00
Avg time in market67.23 min
Max time to recover28.05 days
Longest flat period10.77 days
Average MAE$349.14
Average MFE$619.36
Contracts · slippage1 · 2 ticks
Jan 1, 2024 – Aug 24, 2026 · RTH 6:30 AM – 12:30 PM Pacific, flat by 12:59 PM · all market conditions including economic news events · commissions excluded (example: $5 × 2,421 = $12,105 round-trip).
Backtest 2 · ES · 2 Contracts · 80% HigherEdgeAI™ 3.0 confidence
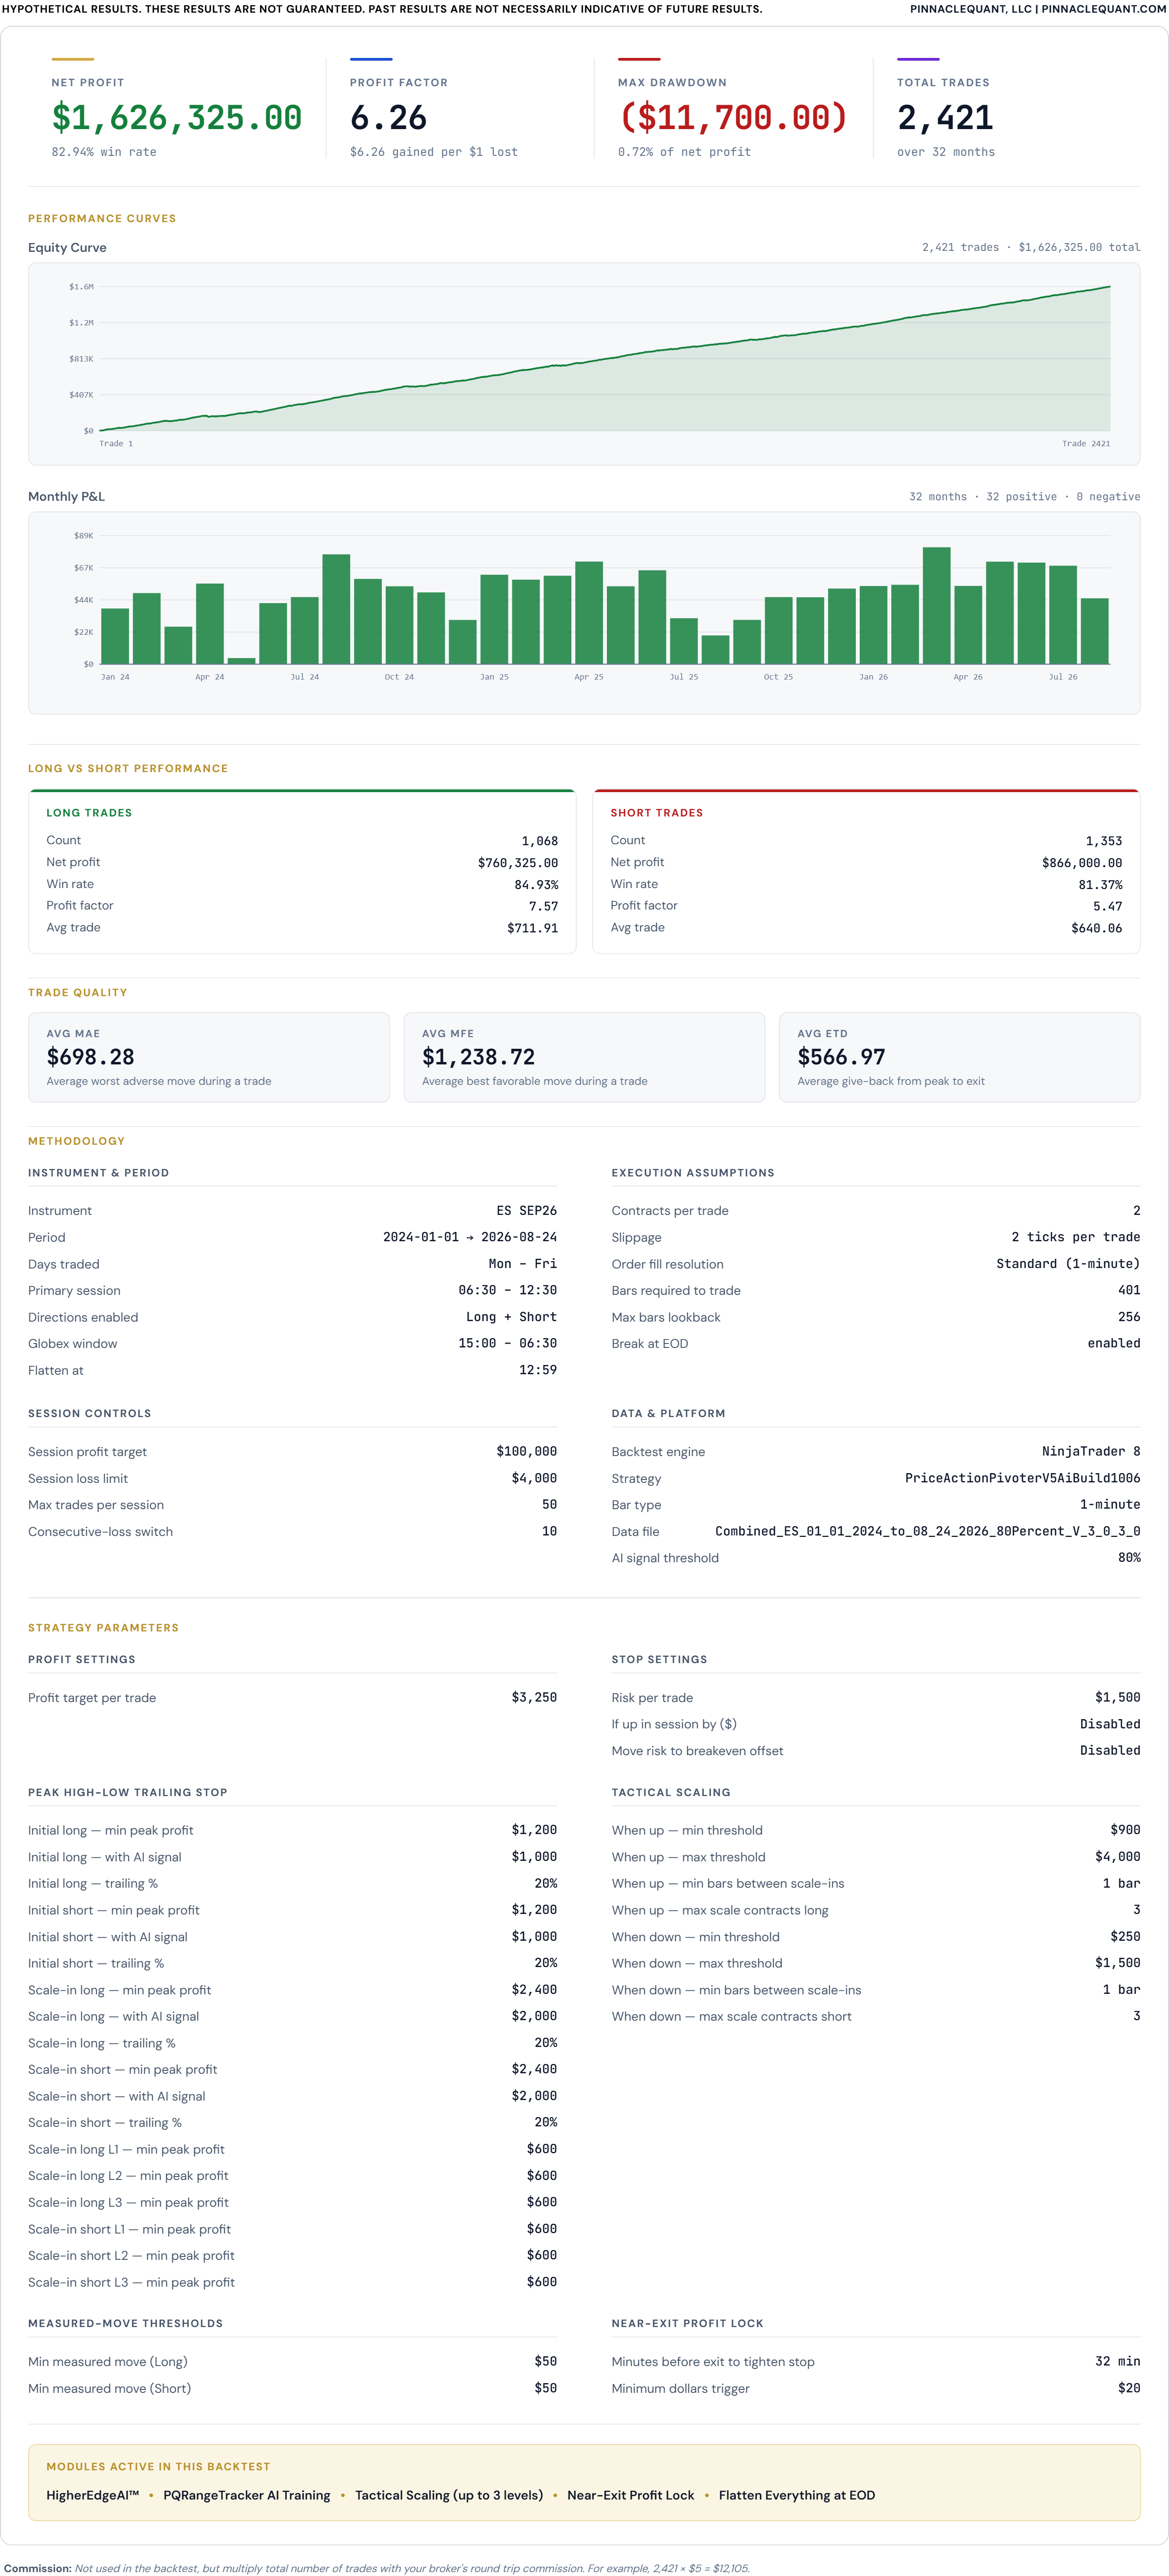
Net profit $1,626,325.00
Gross profit$1,935,600.00
Gross loss($309,275.00)
Profit factor6.26
Max drawdown($11,700.00)
Trades2,421
Win rate82.94%
Winning trades2,008
Losing trades366
Sharpe ratio2.05
Sortino ratio1.00
Avg time in market67.23 min
Max time to recover28.05 days
Longest flat period10.77 days
Average MAE$698.28
Average MFE$1,238.72
Contracts · slippage2 · 2 ticks
Jan 1, 2024 – Aug 24, 2026 · RTH 6:30 AM – 12:30 PM Pacific, flat by 12:59 PM · all market conditions including economic news events · commissions excluded (example: $10 × 2,421 = $24,210 round-trip).
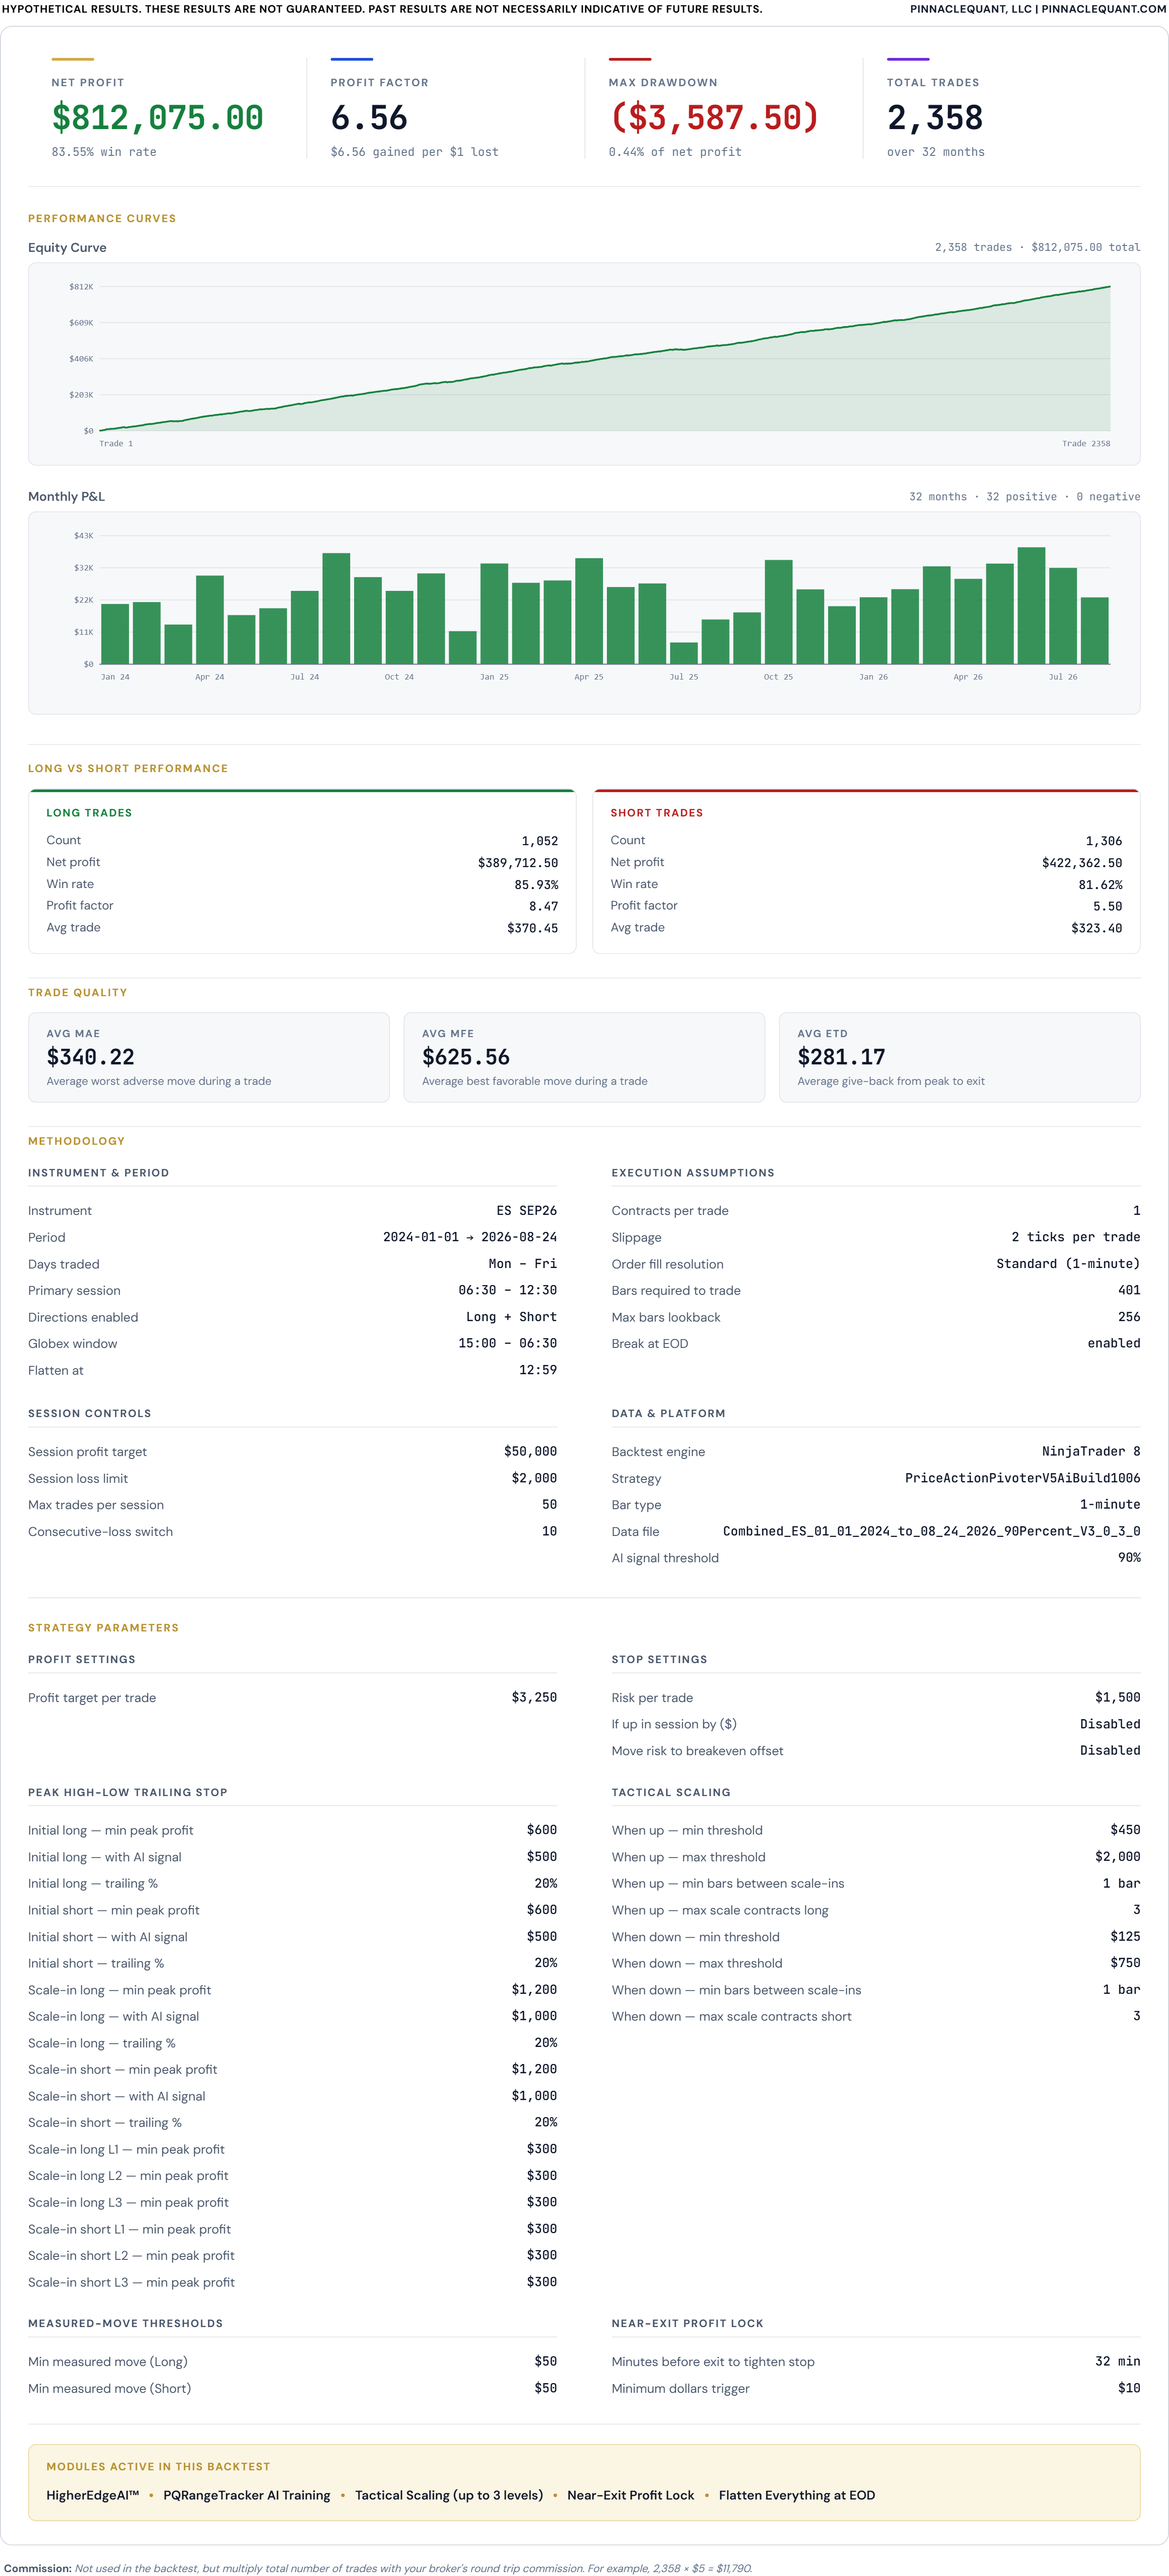
Backtest 3 · ES · 1 Contract · 90% HigherEdgeAI™ 3.0 confidence
Net profit $812,075.00
Gross profit$958,200.00
Gross loss($146,125.00)
Profit factor6.56
Max drawdown($3,587.50)
Trades2,358
Win rate83.55%
Winning trades1,970
Losing trades344
Sharpe ratio2.12
Sortino ratio1.00
Avg time in market64.76 min
Max time to recover18.83 days
Longest flat period10.89 days
Average MAE$340.22
Average MFE$625.56
Contracts · slippage1 · 2 ticks
Jan 1, 2024 – Aug 24, 2026 · RTH 6:30 AM – 12:30 PM Pacific, flat by 12:59 PM · all market conditions including economic news events · commissions excluded (example: $5 × 2,358 = $11,790 round-trip).
Backtest 4 · ES · 2 Contracts · 90% HigherEdgeAI™ 3.0 confidence
Net profit $1,624,150.00
Gross profit$1,916,400.00
Gross loss($292,250.00)
Profit factor6.56
Max drawdown($7,175.00)
Trades2,358
Win rate83.55%
Winning trades1,970
Losing trades344
Sharpe ratio2.12
Sortino ratio1.00
Avg time in market64.76 min
Max time to recover18.83 days
Longest flat period10.89 days
Average MAE$680.45
Average MFE$1,251.11
Contracts · slippage2 · 2 ticks
Jan 1, 2024 – Aug 24, 2026 · RTH 6:30 AM – 12:30 PM Pacific, flat by 12:59 PM · all market conditions including economic news events · commissions excluded (example: $10 × 2,358 = $23,580 round-trip).
Backtest 5 · NQ · 1 Contract · 80% HigherEdgeAI™ 3.0 confidence
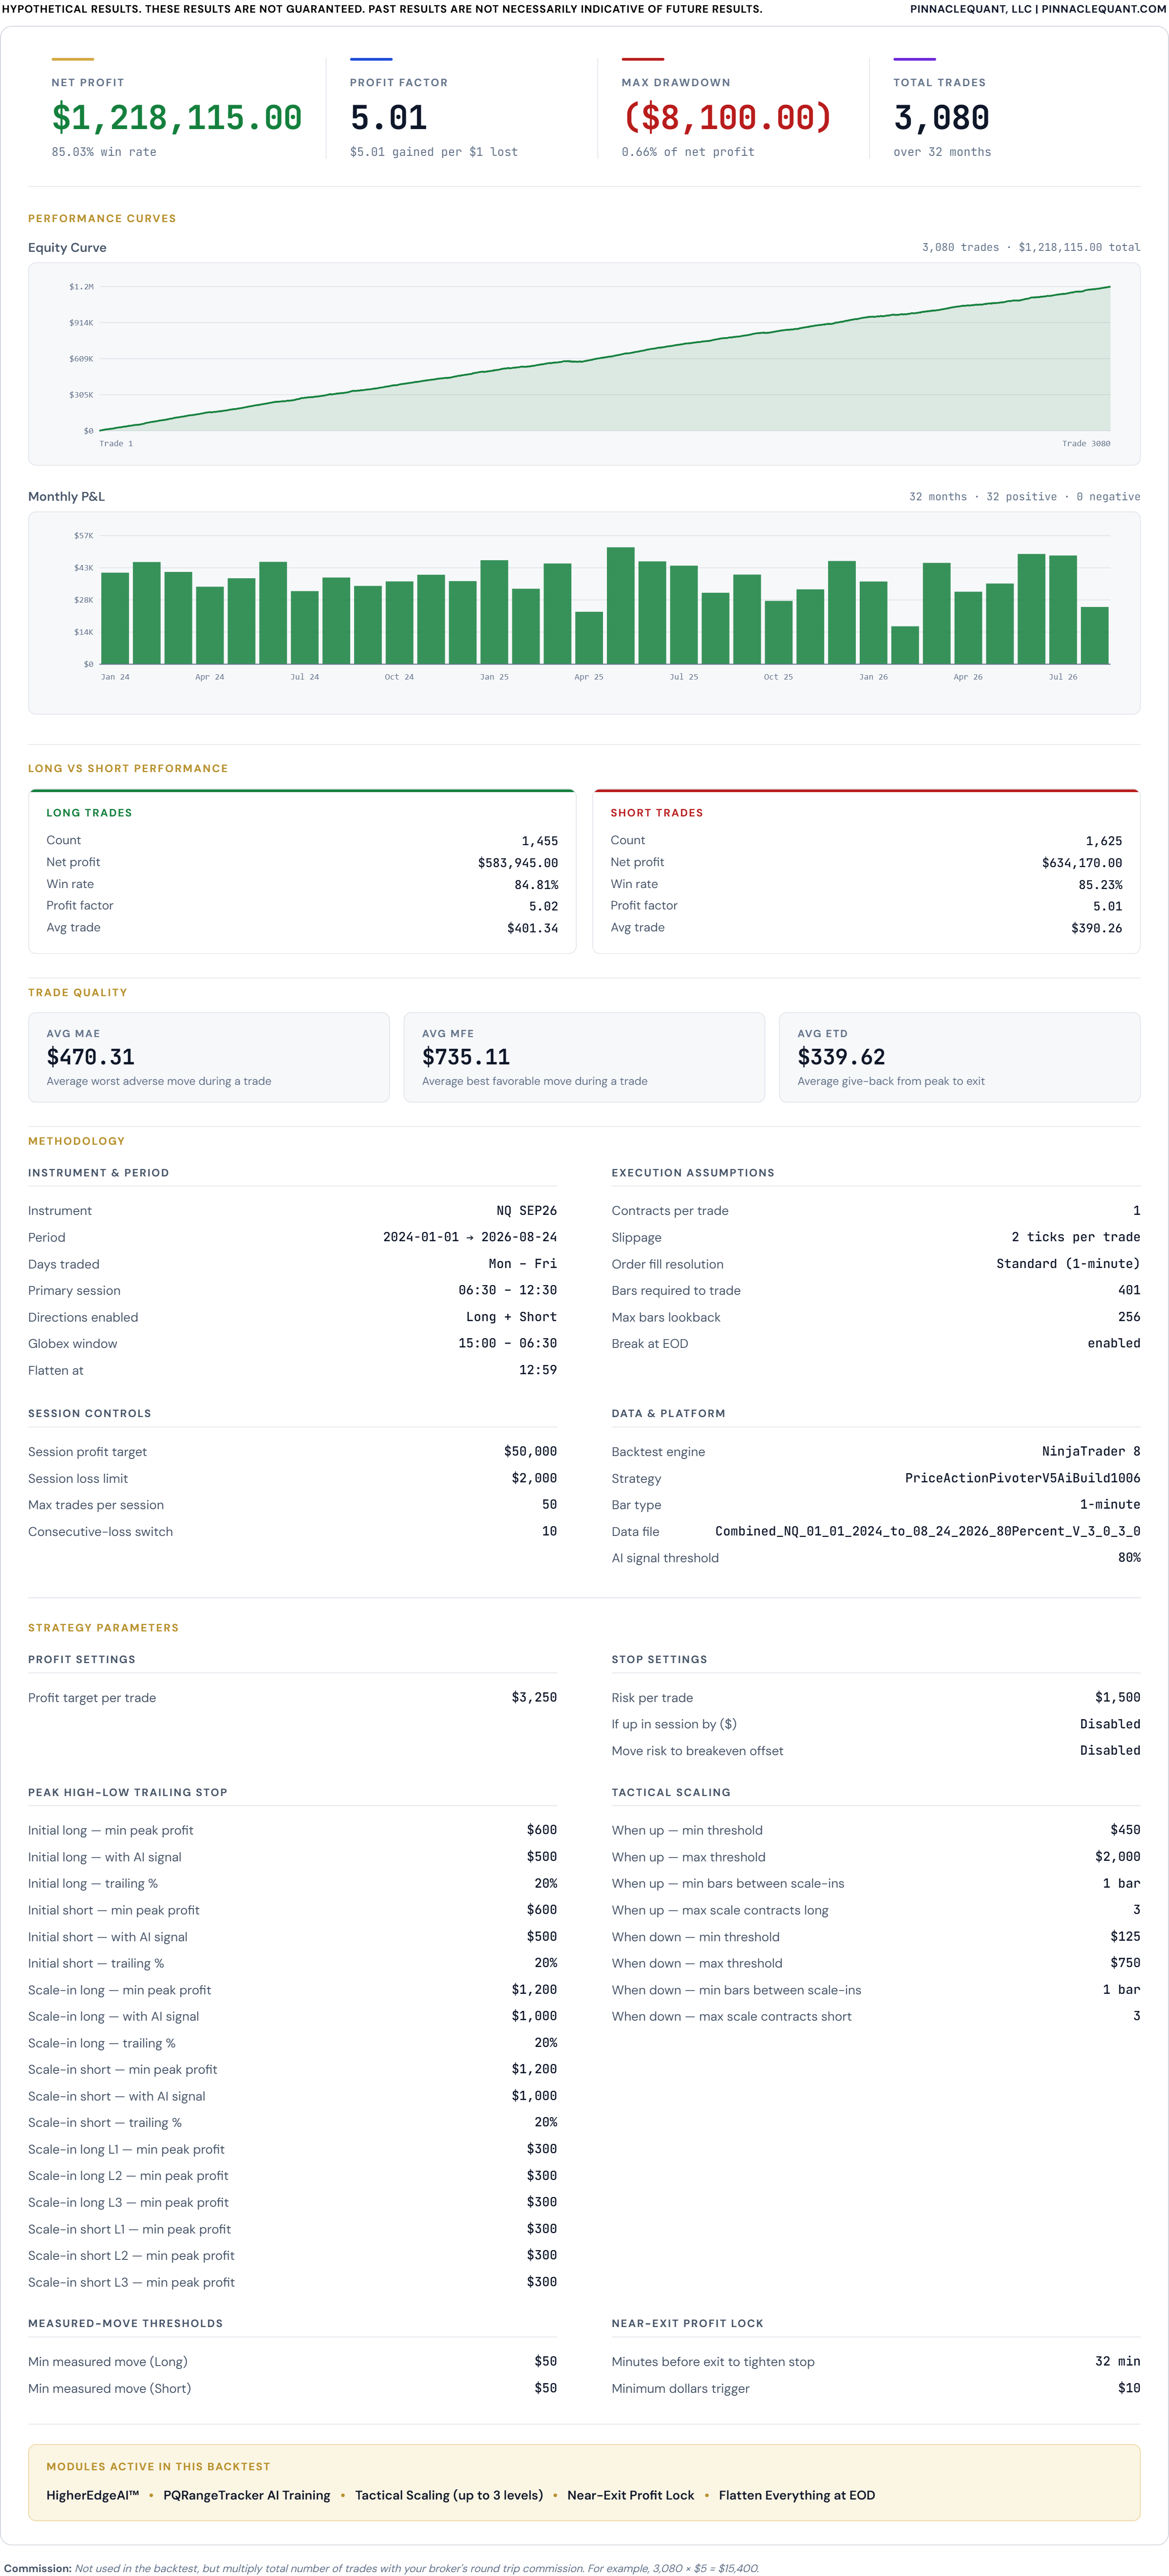
Net profit $1,218,115.00
Gross profit$1,521,740.00
Gross loss($303,625.00)
Profit factor5.01
Max drawdown($8,100.00)
Trades3,080
Win rate85.03%
Winning trades2,619
Losing trades353
Sharpe ratio2.34
Sortino ratio1.00
Avg time in market29.30 min
Max time to recover14.03 days
Longest flat period10.76 days
Average MAE$470.31
Average MFE$735.11
Contracts · slippage1 · 2 ticks
Jan 1, 2024 – Aug 24, 2026 · RTH 6:30 AM – 12:30 PM Pacific, flat by 12:59 PM · all market conditions including economic news events · commissions excluded (example: $5 × 3,080 = $15,400 round-trip).
Backtest 6 · NQ · 2 Contracts · 80% HigherEdgeAI™ 3.0 confidence
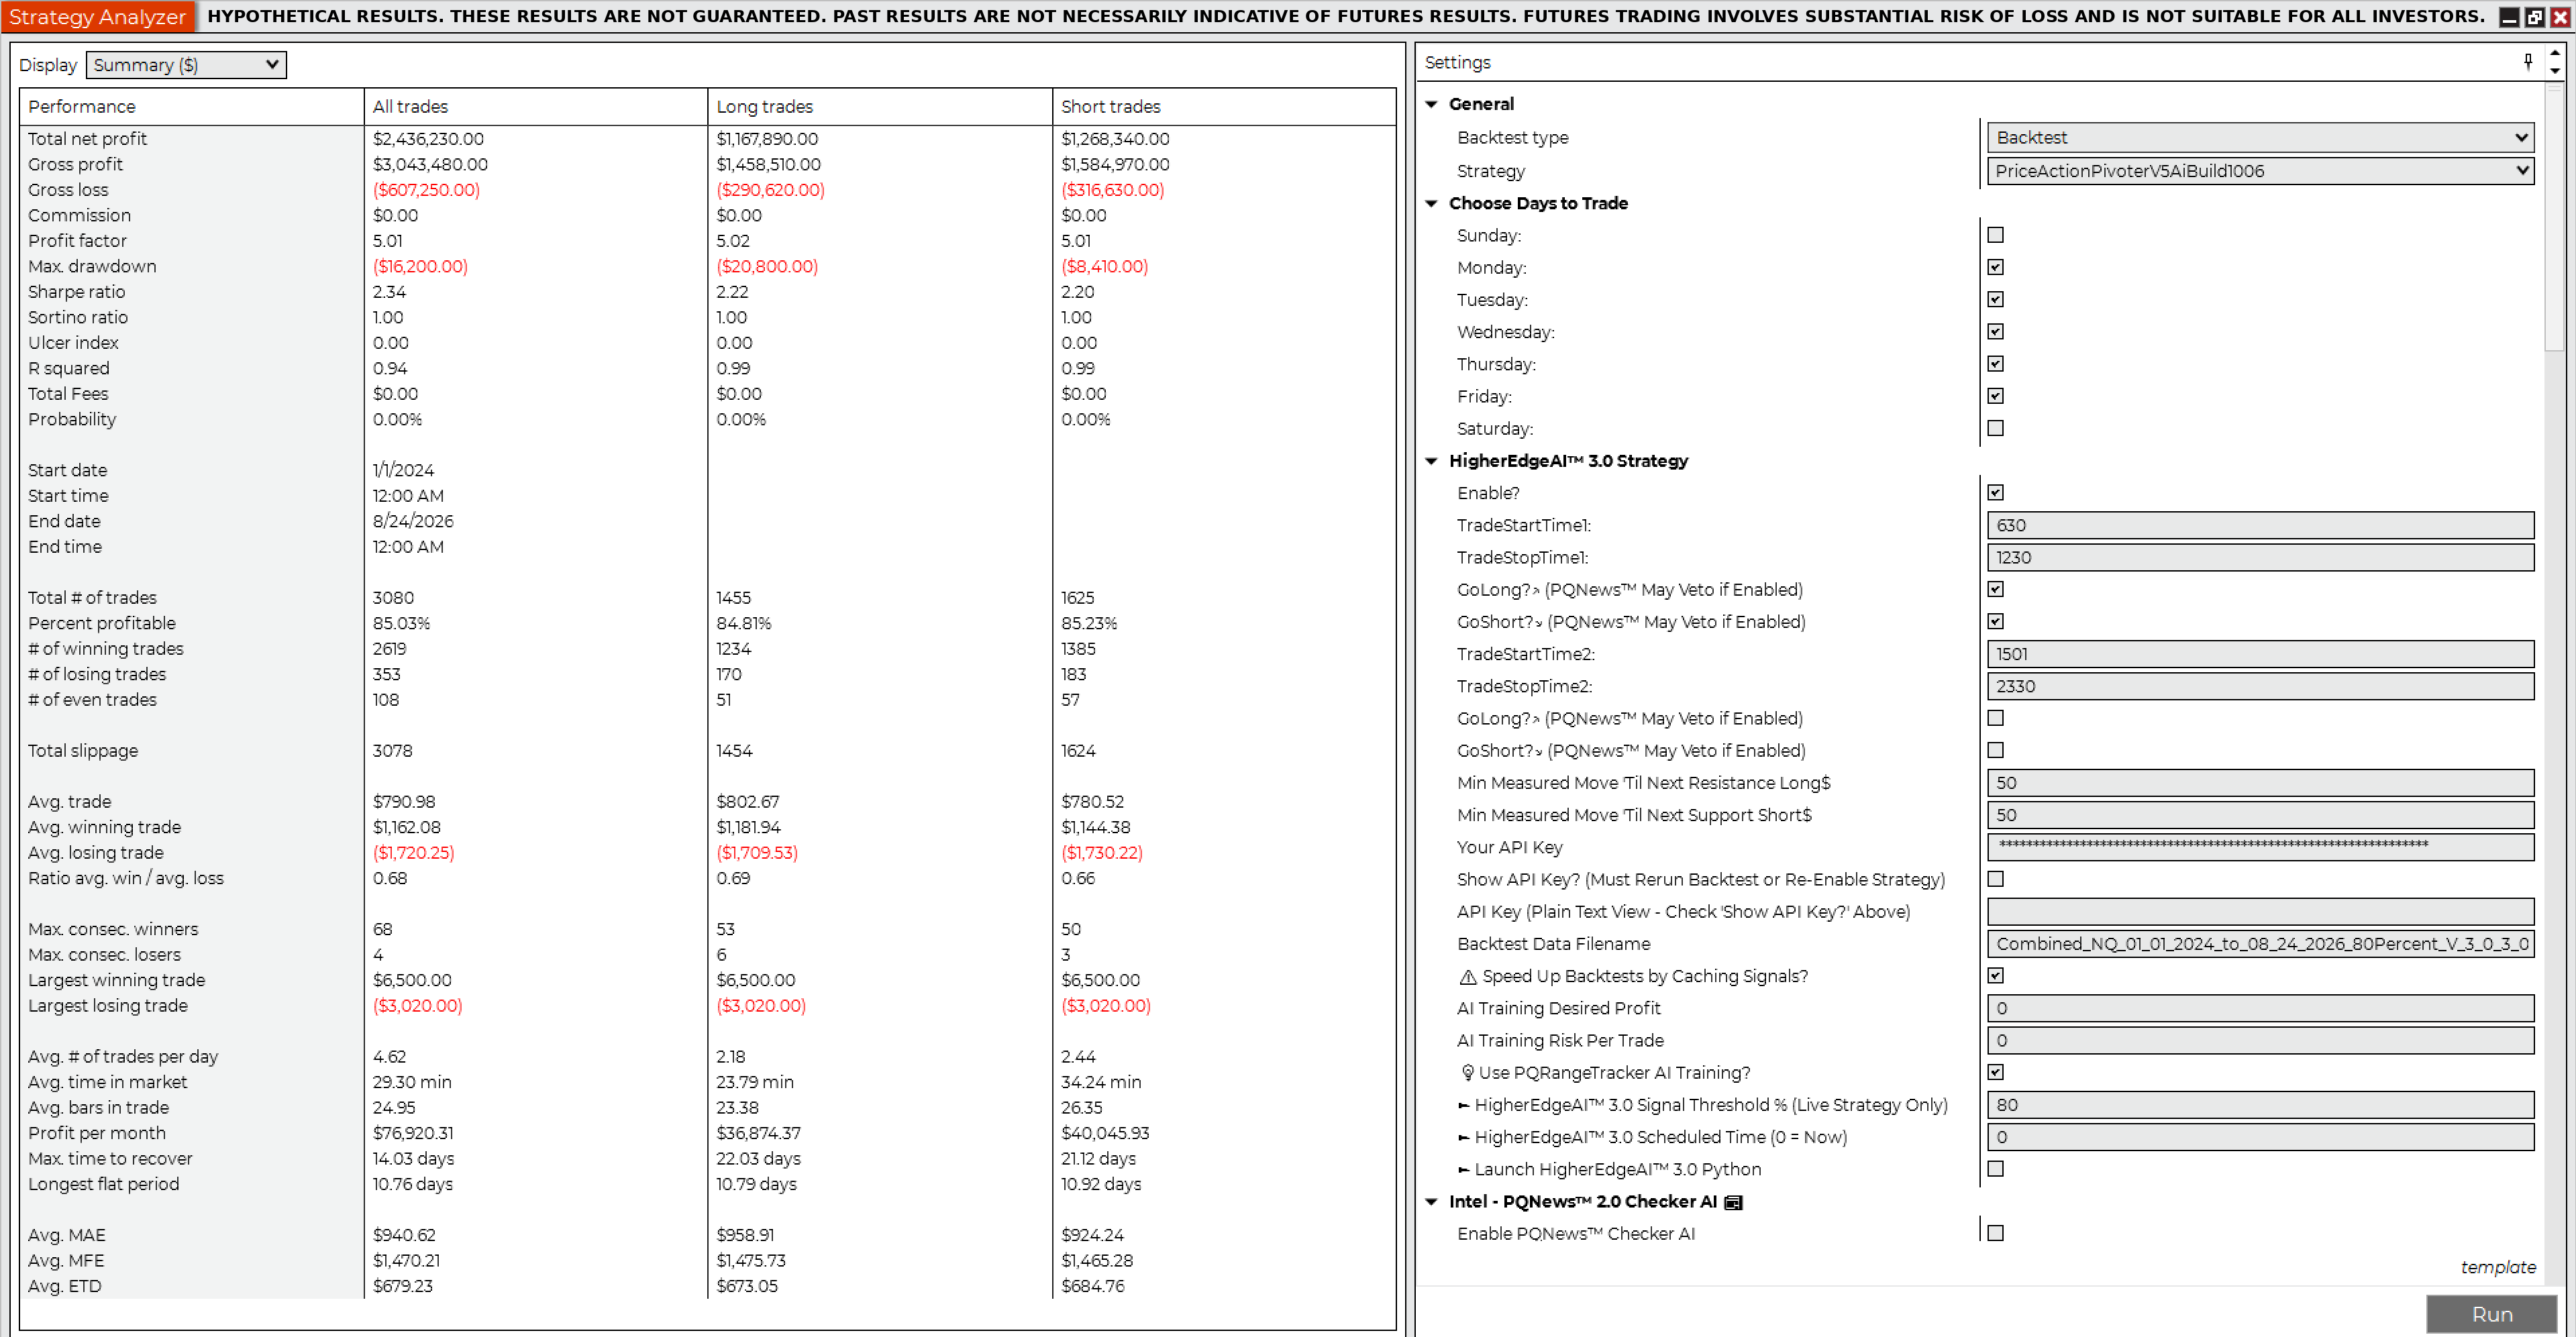
Net profit $2,436,230.00
Gross profit$3,043,480.00
Gross loss($607,250.00)
Profit factor5.01
Max drawdown($16,200.00)
Trades3,080
Win rate85.03%
Winning trades2,619
Losing trades353
Sharpe ratio2.34
Sortino ratio1.00
Avg time in market29.30 min
Max time to recover14.03 days
Longest flat period10.76 days
Average MAE$940.62
Average MFE$1,470.21
Contracts · slippage2 · 2 ticks
Jan 1, 2024 – Aug 24, 2026 · RTH 6:30 AM – 12:30 PM Pacific, flat by 12:59 PM · all market conditions including economic news events · commissions excluded (example: $10 × 3,080 = $30,800 round-trip).
Backtest 7 · NQ · 1 Contract · 90% HigherEdgeAI™ 3.0 confidence
Net profit $1,217,730.00
Gross profit$1,474,325.00
Gross loss($256,595.00)
Profit factor5.75
Max drawdown($4,700.00)
Trades3,003
Win rate85.11%
Winning trades2,556
Losing trades321
Sharpe ratio2.25
Sortino ratio1.00
Avg time in market30.56 min
Max time to recover6.82 days
Longest flat period10.77 days
Average MAE$461.55
Average MFE$735.79
Contracts · slippage1 · 2 ticks
Jan 1, 2024 – Aug 24, 2026 · RTH 6:30 AM – 12:30 PM Pacific, flat by 12:59 PM · all market conditions including economic news events · commissions excluded (example: $5 × 3,003 = $15,015 round-trip).
Backtest 8 · NQ · 2 Contracts · 90% HigherEdgeAI™ 3.0 confidence
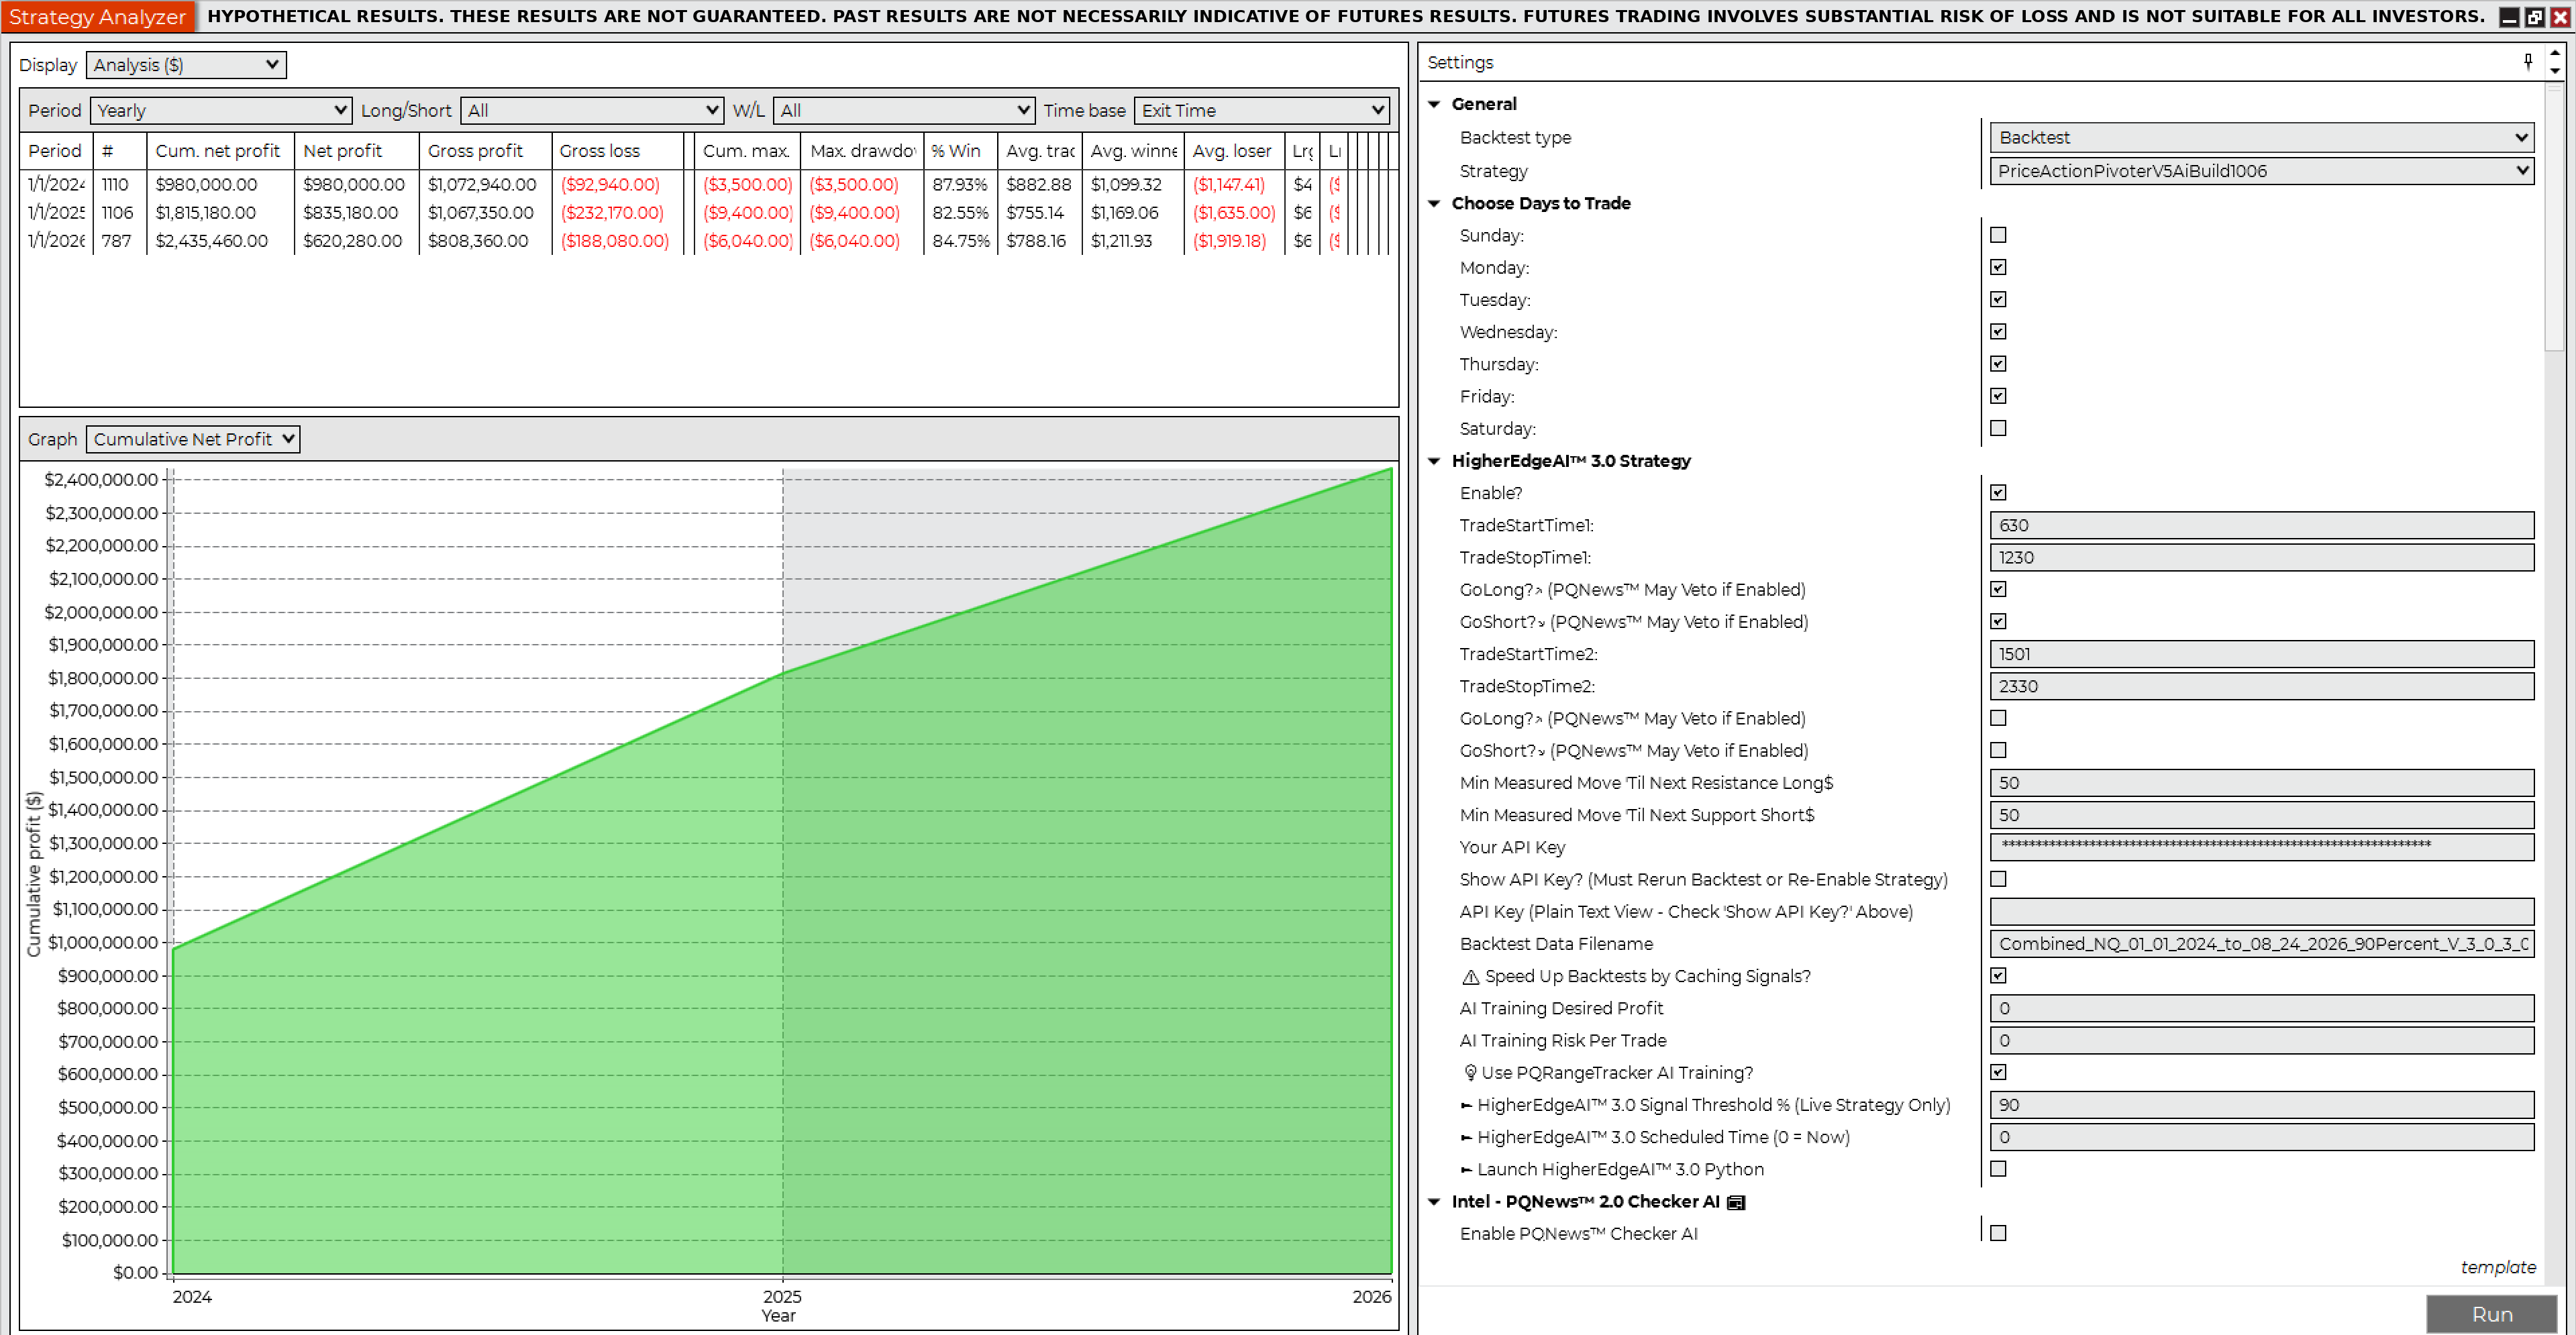
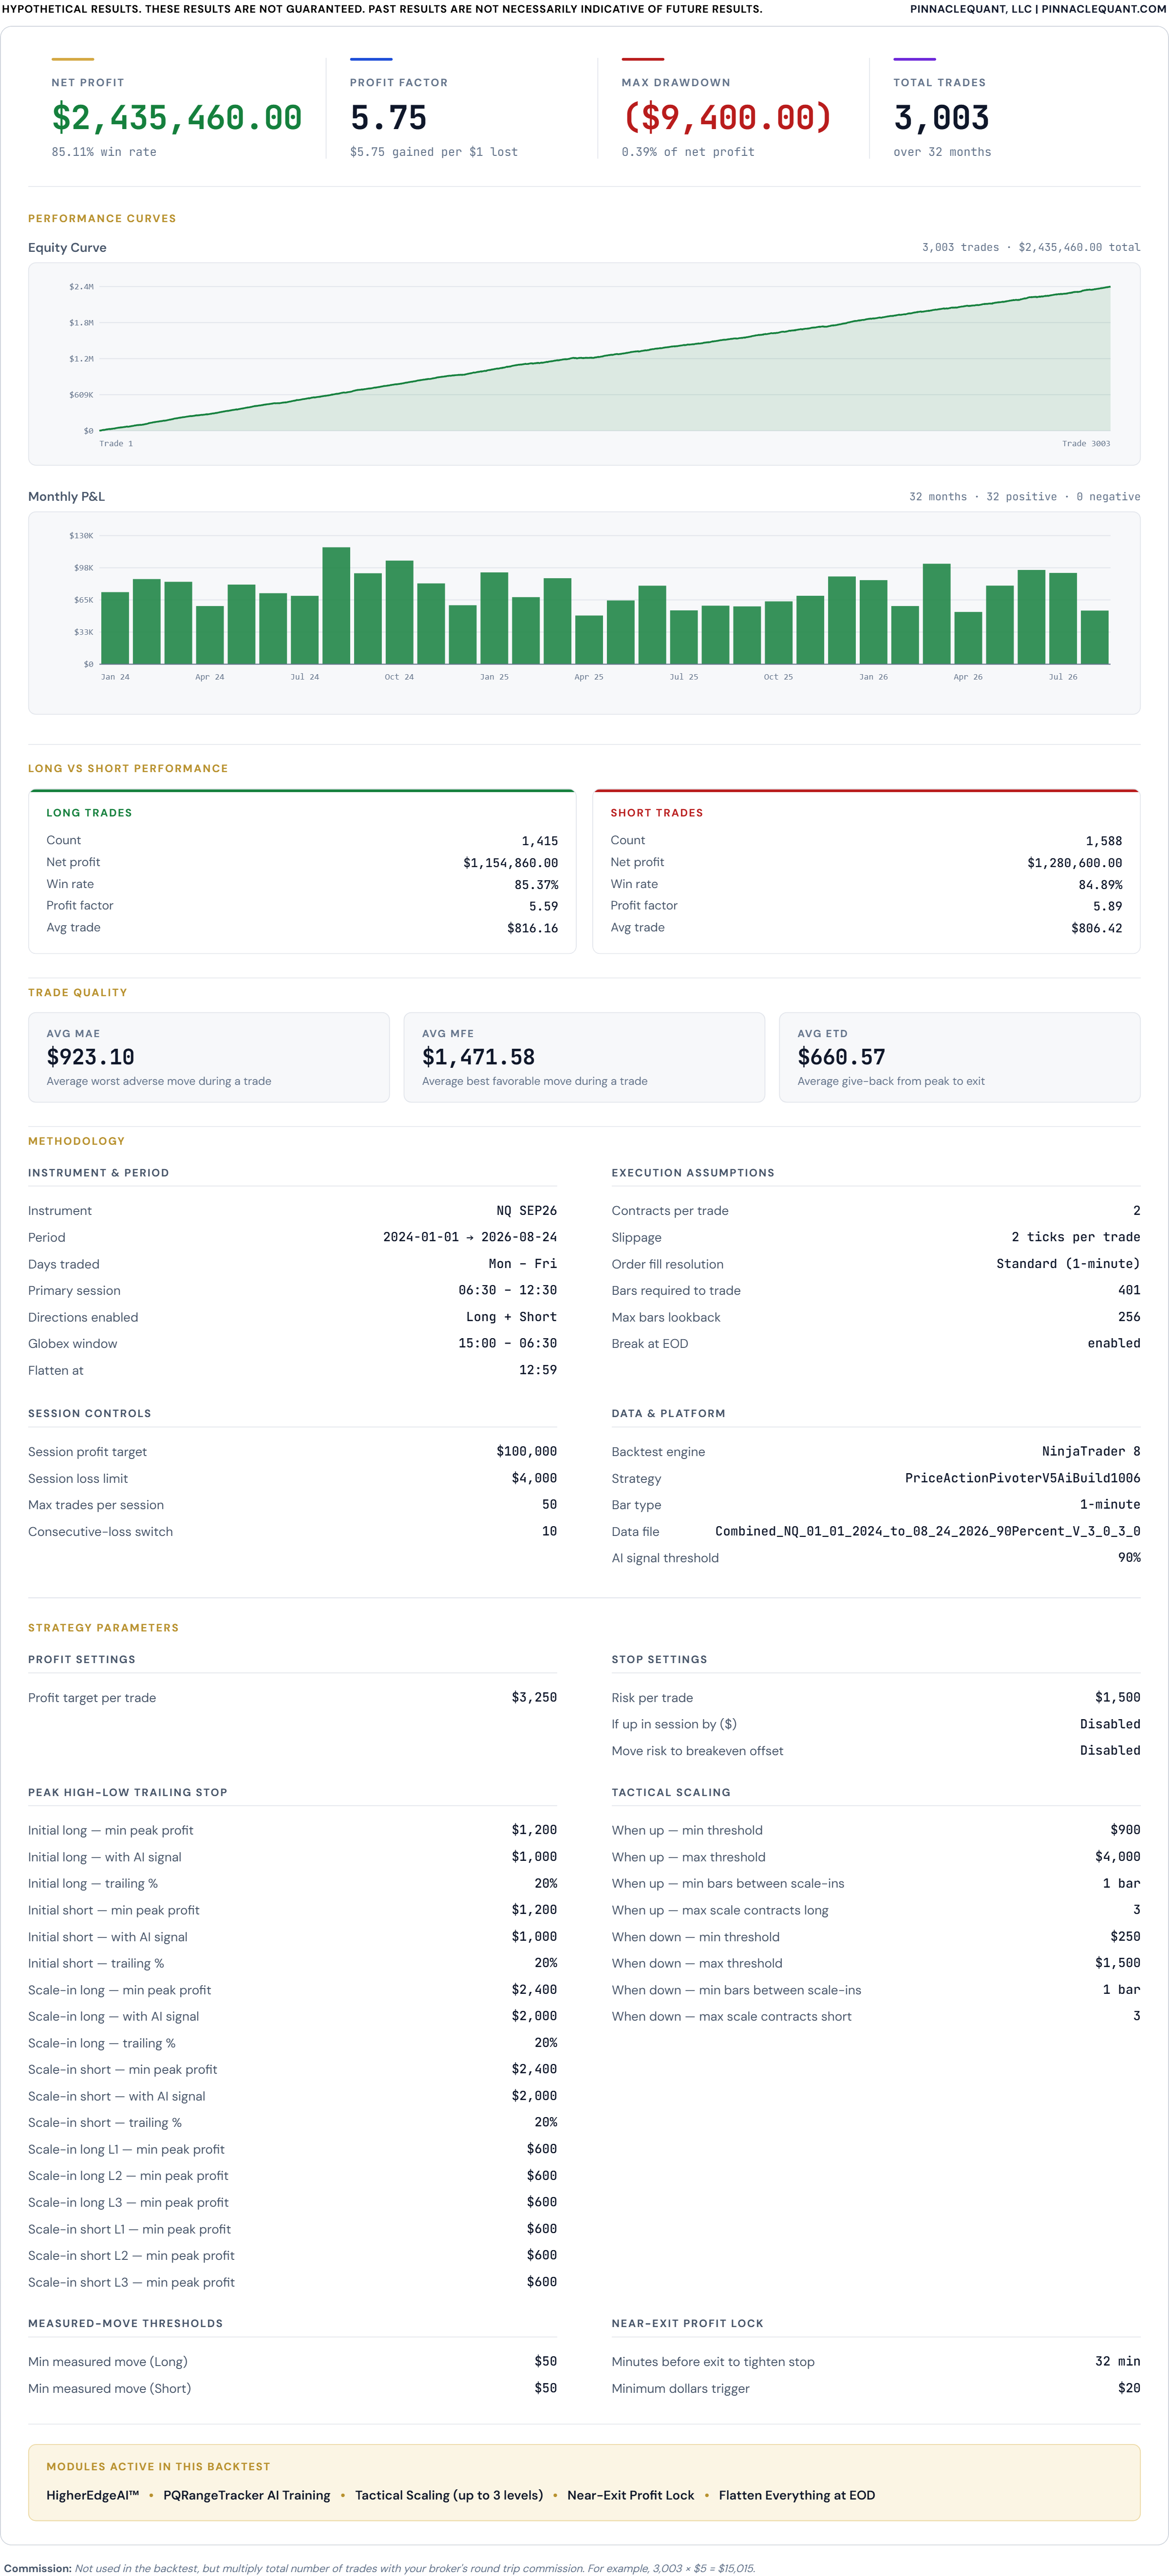
Net profit $2,435,460.00
Gross profit$2,948,650.00
Gross loss($513,190.00)
Profit factor5.75
Max drawdown($9,400.00)
Trades3,003
Win rate85.11%
Winning trades2,556
Losing trades321
Sharpe ratio2.25
Sortino ratio1.00
Avg time in market30.56 min
Max time to recover6.82 days
Longest flat period10.77 days
Average MAE$923.10
Average MFE$1,471.58
Contracts · slippage2 · 2 ticks
Jan 1, 2024 – Aug 24, 2026 · RTH 6:30 AM – 12:30 PM Pacific, flat by 12:59 PM · all market conditions including economic news events · commissions excluded (example: $10 × 3,003 = $30,030 round-trip).

While no backtest is 100% accurate and past results are not necessarily indicative of future results, the above hypothetical backtests provide valuable insights into how this machine learning automated trading system uses real-time A.I. signals to identify trades and manage them throughout their full lifecycle, with granular user control over entries, exits, and risk management.

CFTC RULE 4.41 – HYPOTHETICAL OR SIMULATED PERFORMANCE RESULTS HAVE CERTAIN LIMITATIONS. UNLIKE AN ACTUAL PERFORMANCE RECORD, SIMULATED RESULTS DO NOT REPRESENT ACTUAL TRADING. ALSO, SINCE THE TRADES HAVE NOT BEEN EXECUTED, THE RESULTS MAY HAVE UNDER-OR-OVER COMPENSATED FOR THE IMPACT, IF ANY, OF CERTAIN MARKET FACTORS, SUCH AS LACK OF LIQUIDITY. SIMULATED TRADING PROGRAMS IN GENERAL ARE ALSO SUBJECT TO THE FACT THAT THEY ARE DESIGNED WITH THE BENEFIT OF HINDSIGHT. NO REPRESENTATION IS BEING MADE THAT ANY ACCOUNT WILL OR IS LIKELY TO ACHIEVE PROFIT OR LOSSES SIMILAR TO THOSE SHOWN.
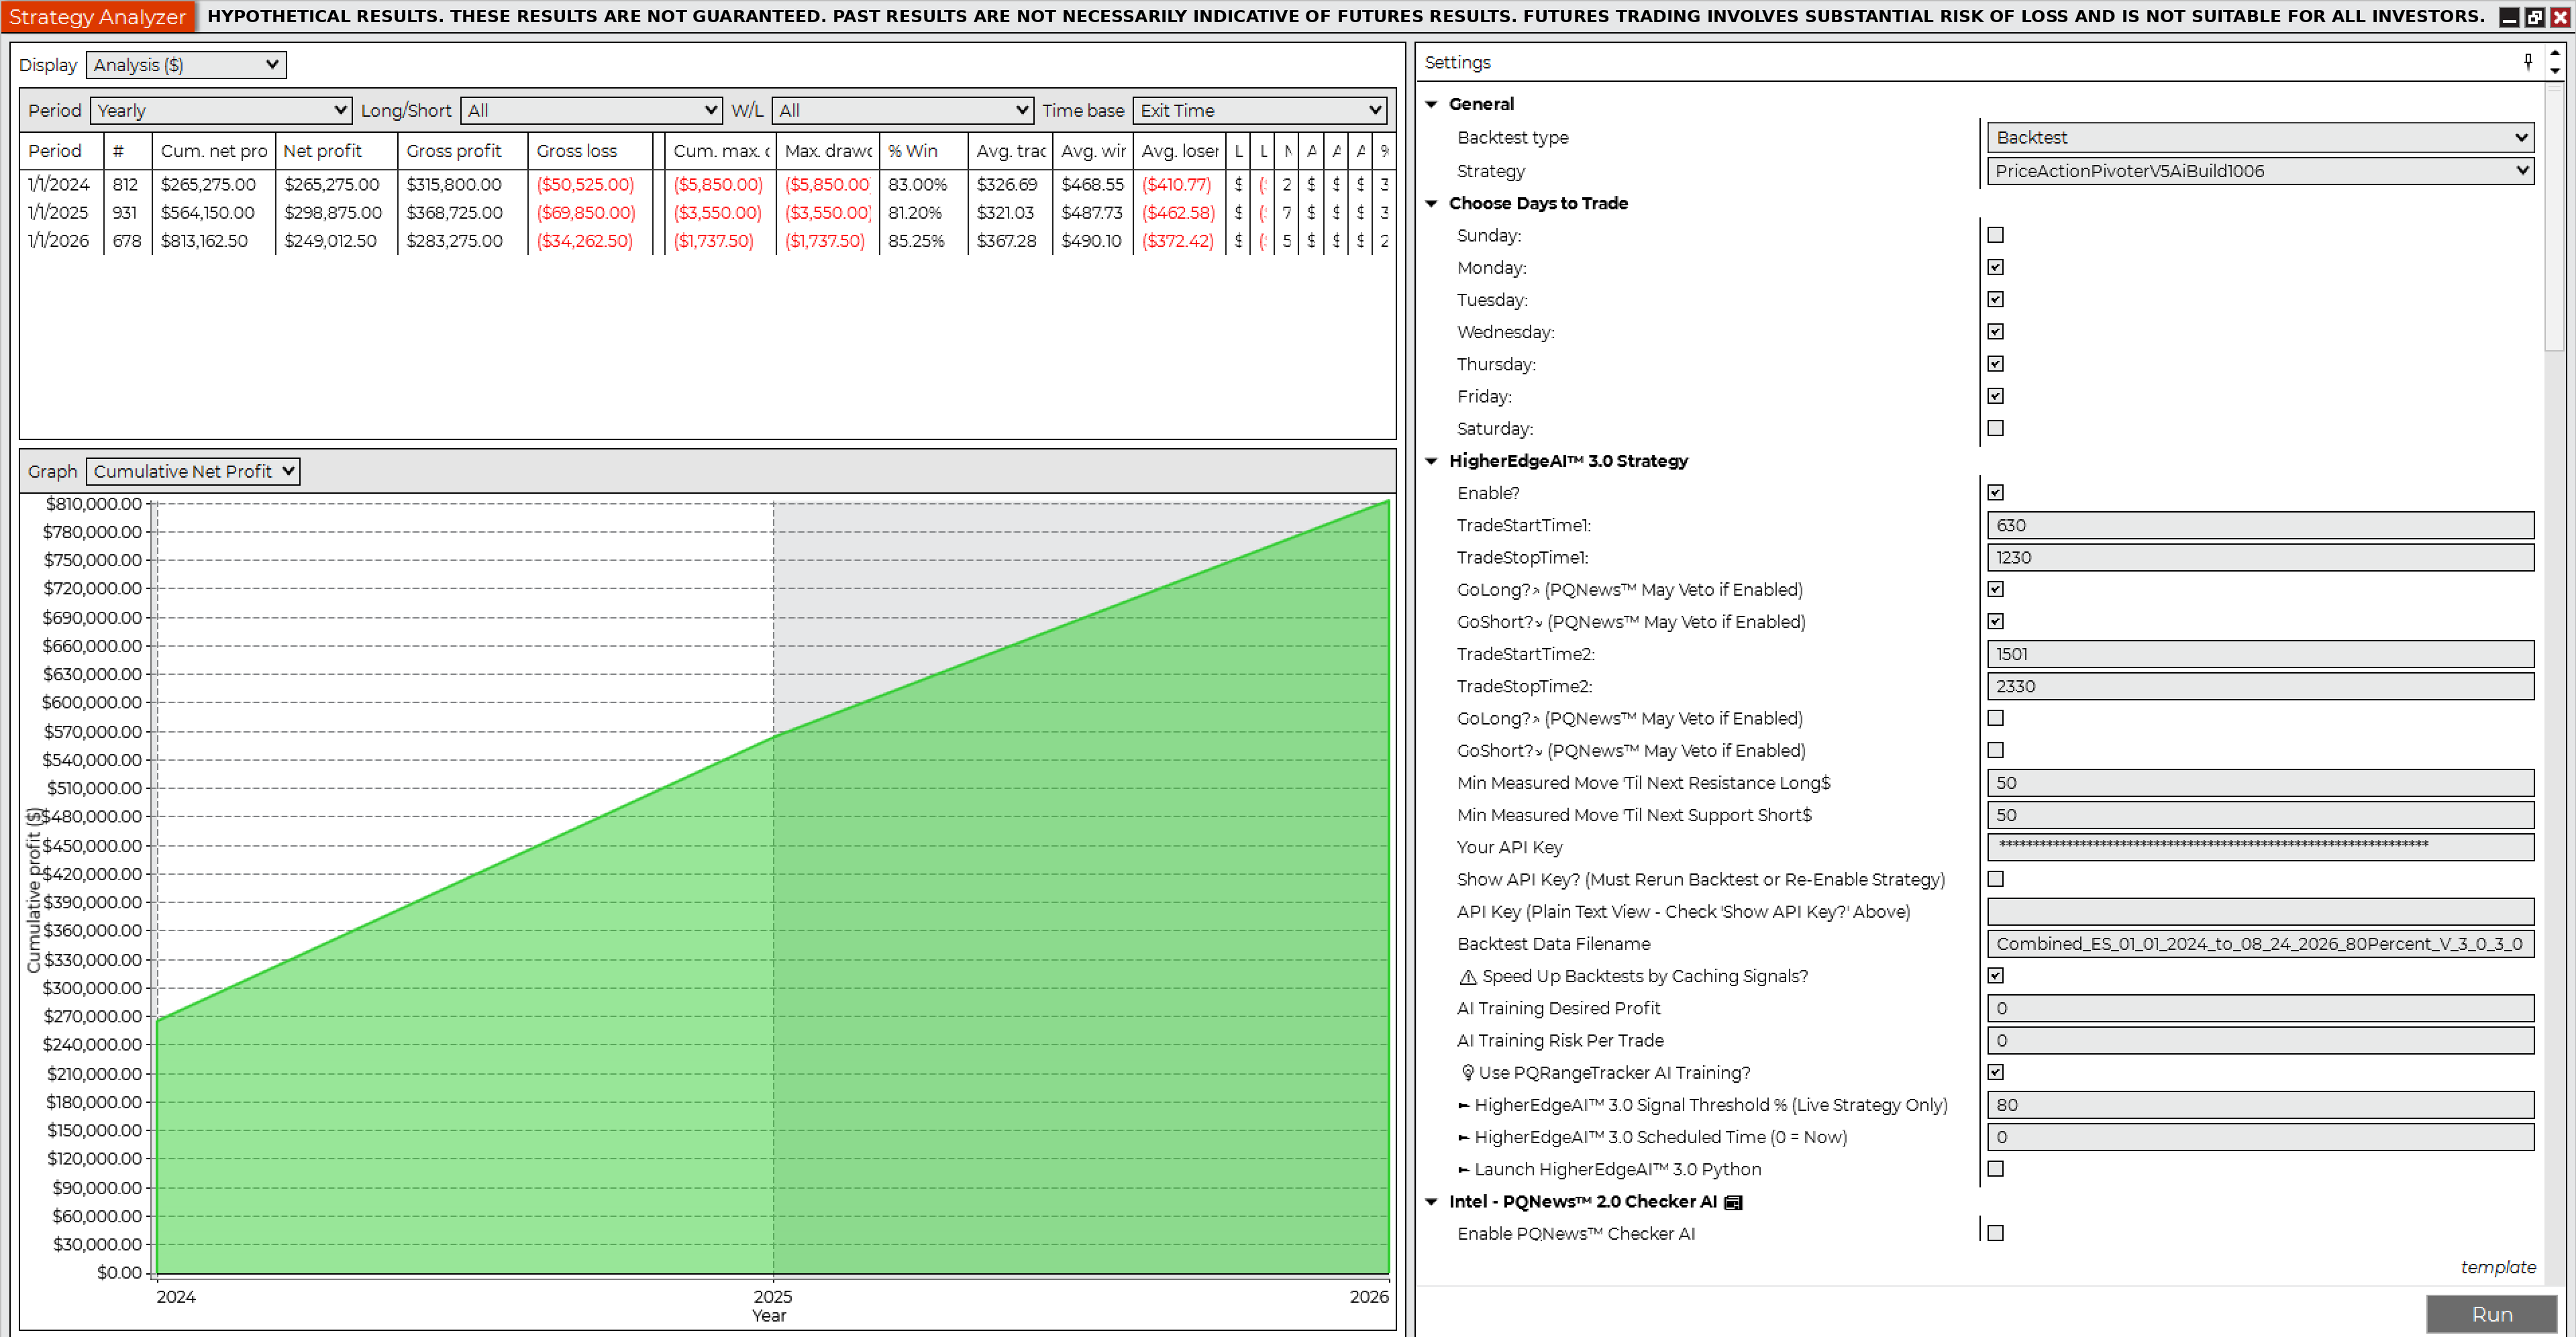
Backtest 1 · NinjaTrader Strategy AnalyzerES · 1 Contract · 80% HigherEdgeAI™ 3.0 Confidence Threshold
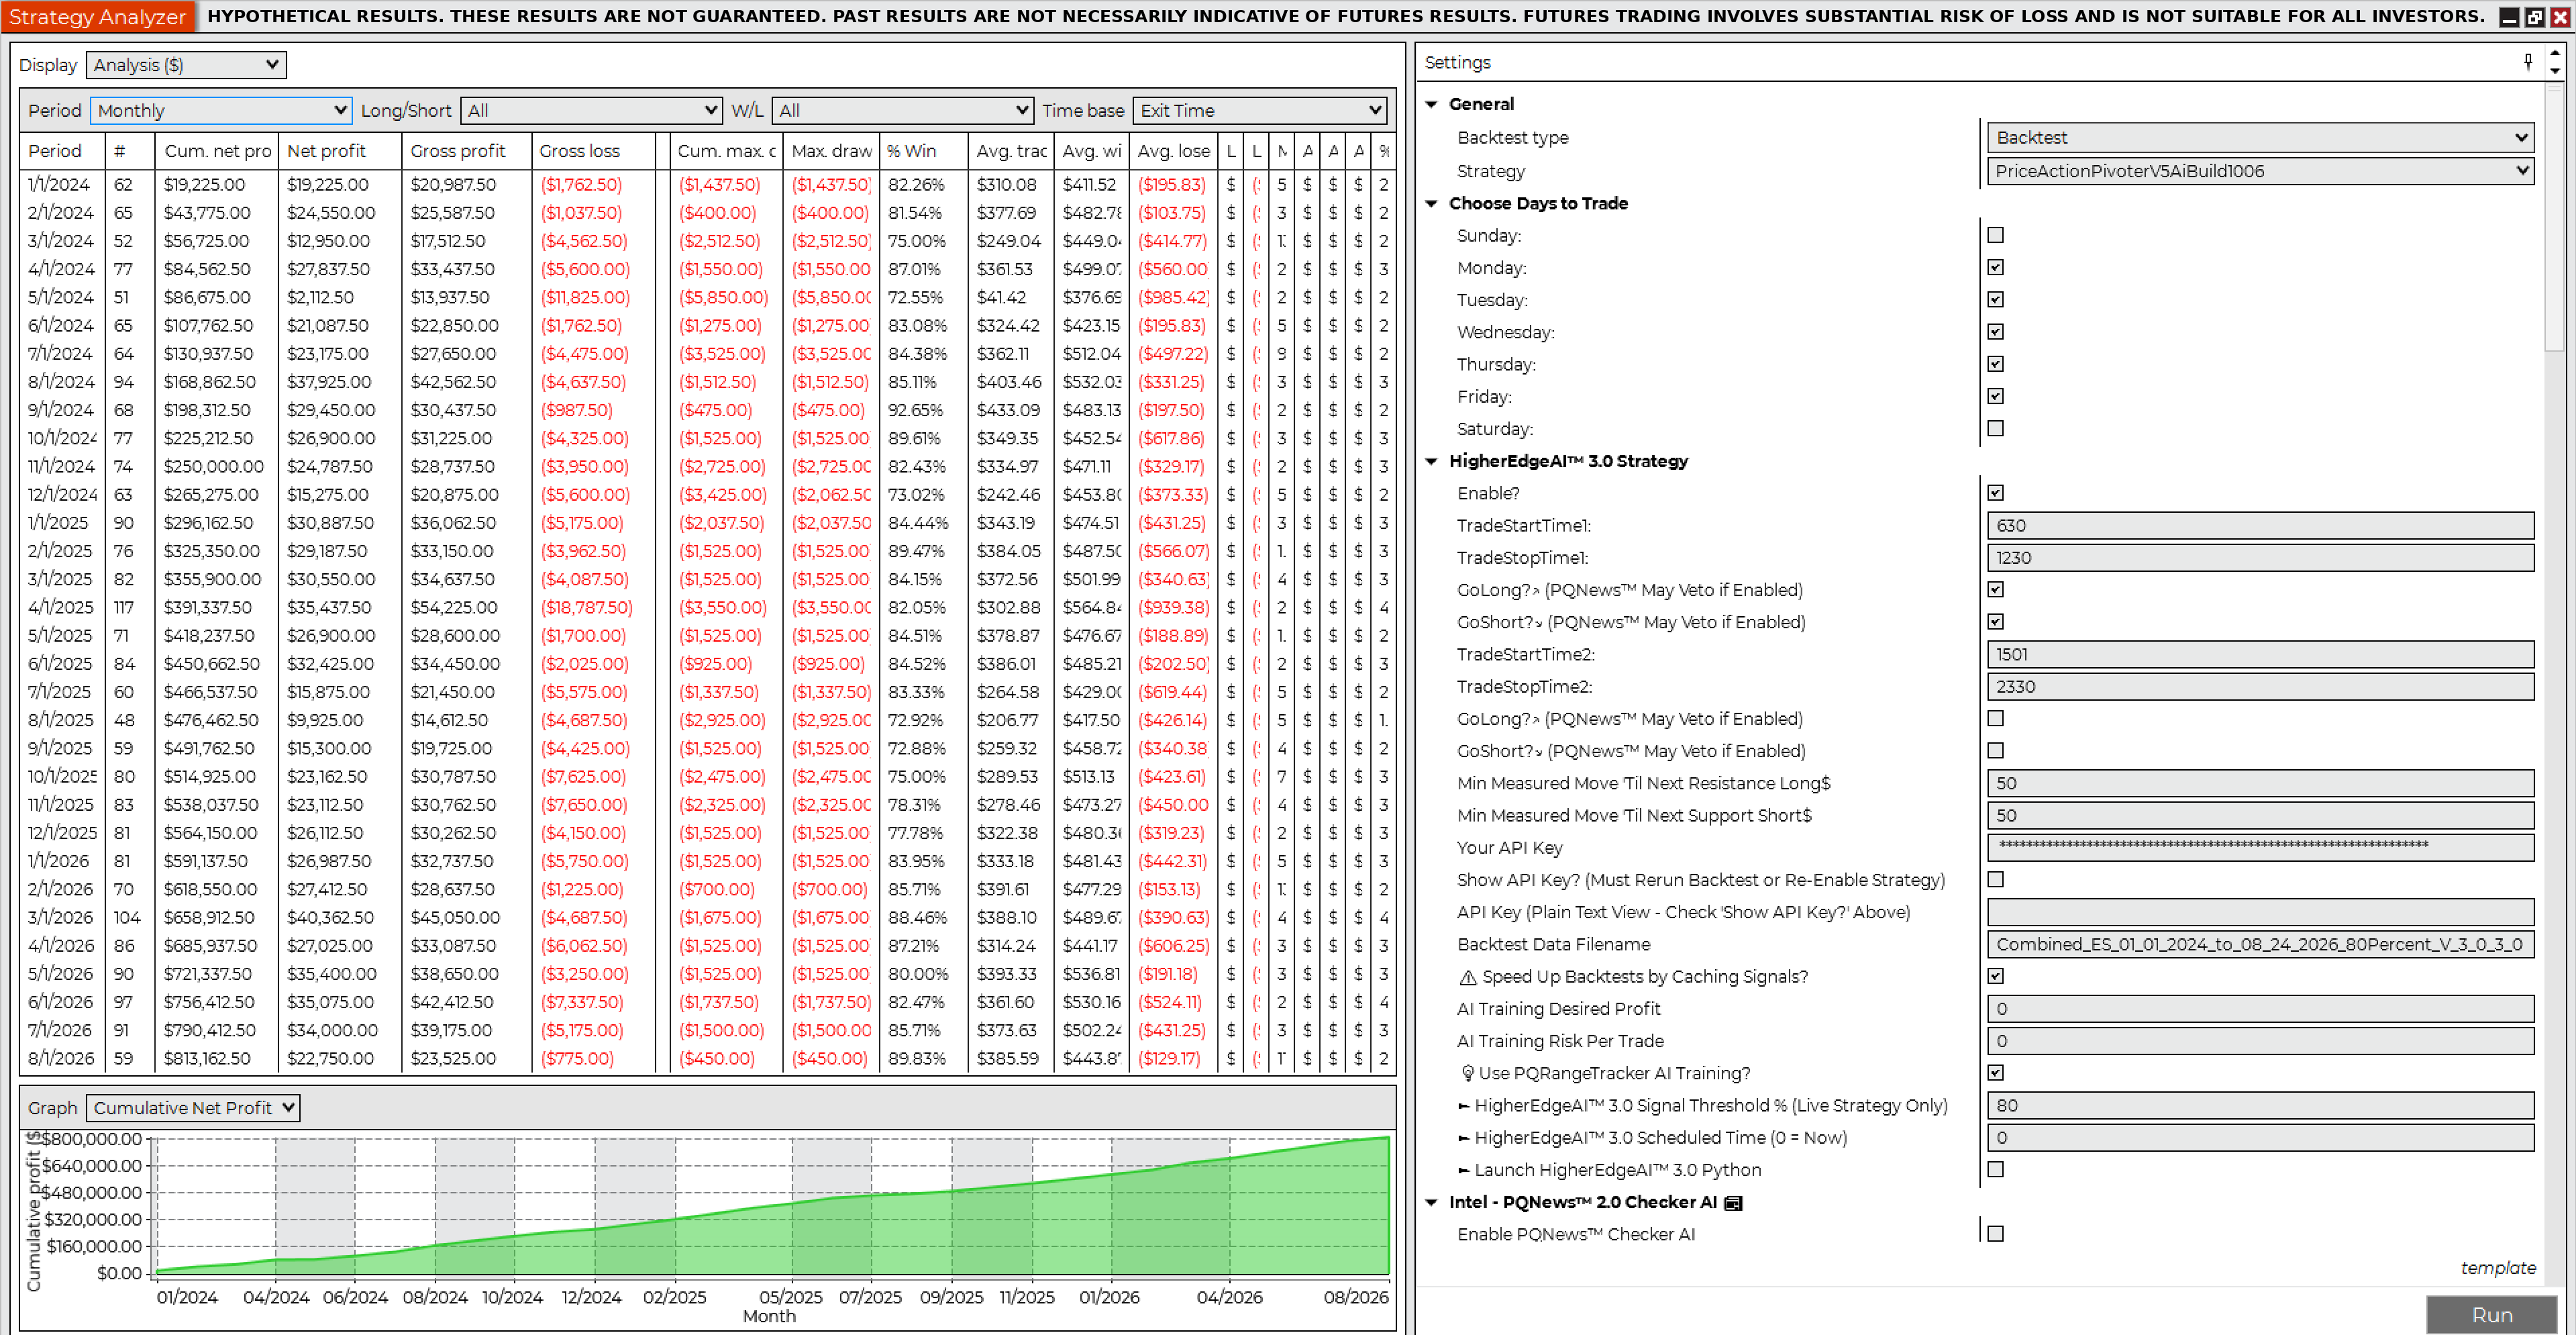
Hypothetical net profit$813,162.50

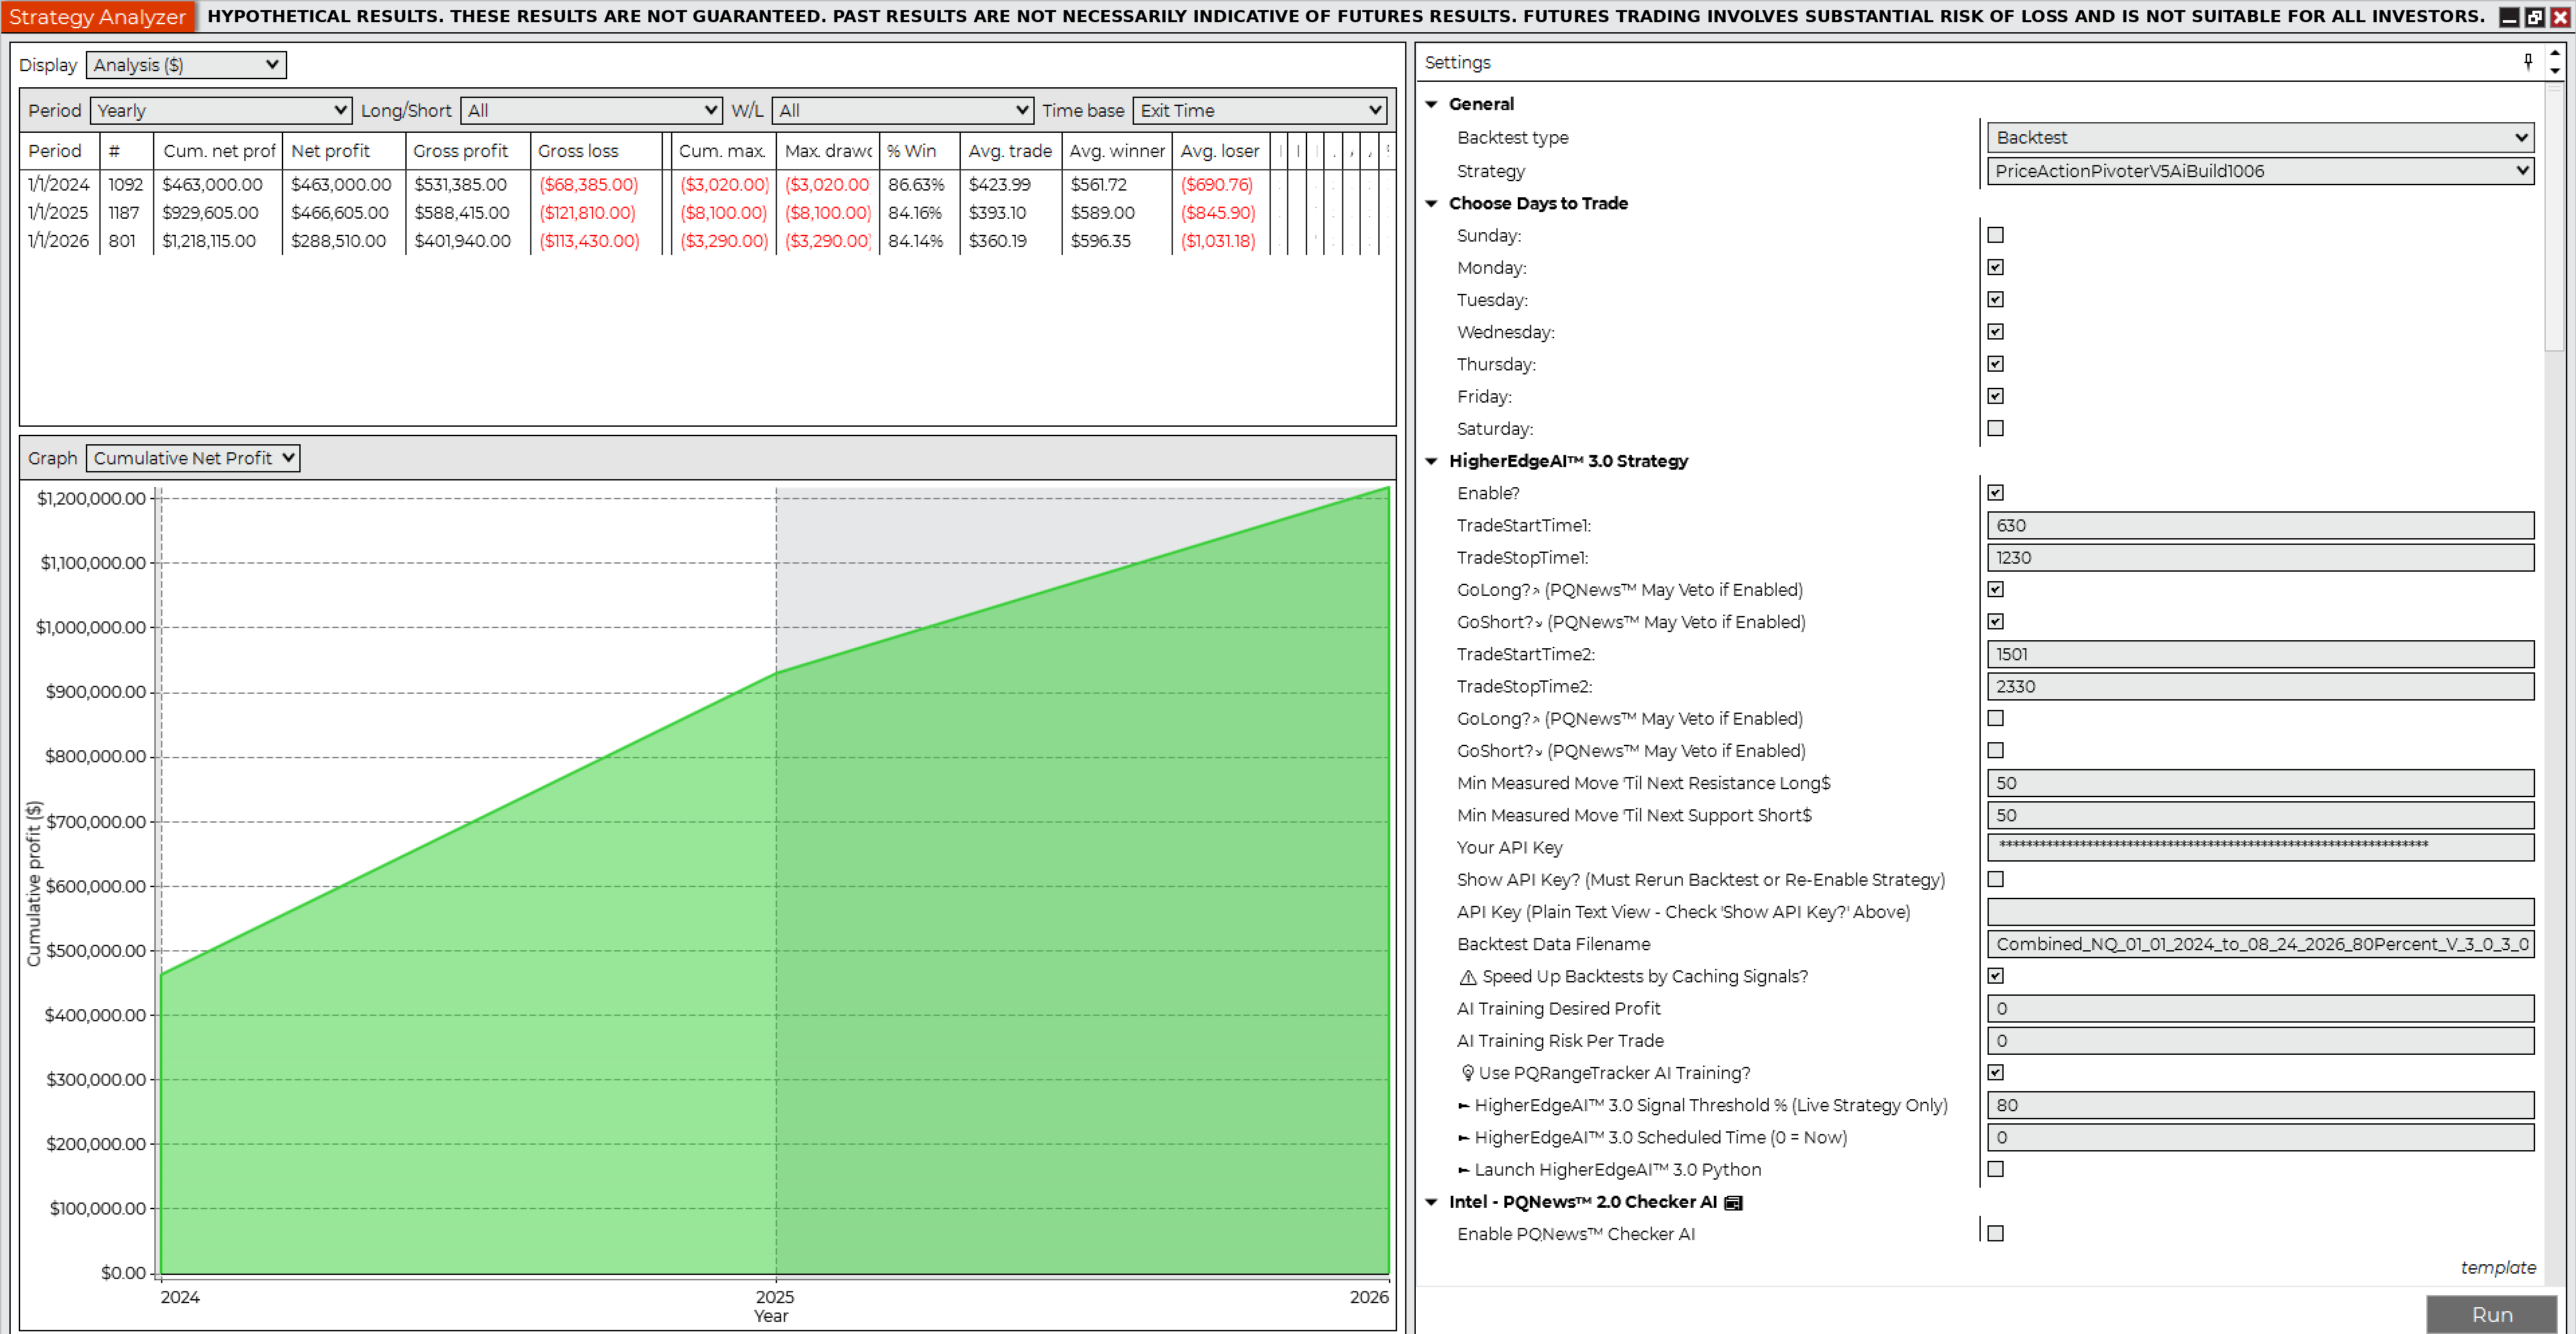
NinjaTrader Strategy Analyzer Summary, Backtest 1, ES 1 Contract 80%NinjaTrader Strategy Analyzer Monthly, Backtest 1, ES 1 Contract 80%NinjaTrader Strategy Analyzer Yearly, Backtest 1, ES 1 Contract 80%

NinjaTrader trade details, Backtest 1
Net profit$813,162.50
Gross profit$967,800.00
Gross loss($154,637.50)
Profit factor6.26
Max drawdown($5,850.00)
Number of trades2,421
Win rate82.94%
Winning trades2,008
Losing trades366
Start date1/1/2024
End date8/24/2026
Hours traded6:30 AM – 12:30 PM Pacific
Flatten everything12:59 PM Pacific
Sortino ratio1.00
Sharpe ratio2.05
Average time in market67.23 min
Max time to recover28.05 days
Longest flat period10.77 days
Average MAE$349.14
Average MFE$619.36
Market conditionAll, incl. economic news events
Contracts1
Slippage2 ticks
CommissionNot included; e.g. $5 × 2,421 = $12,105
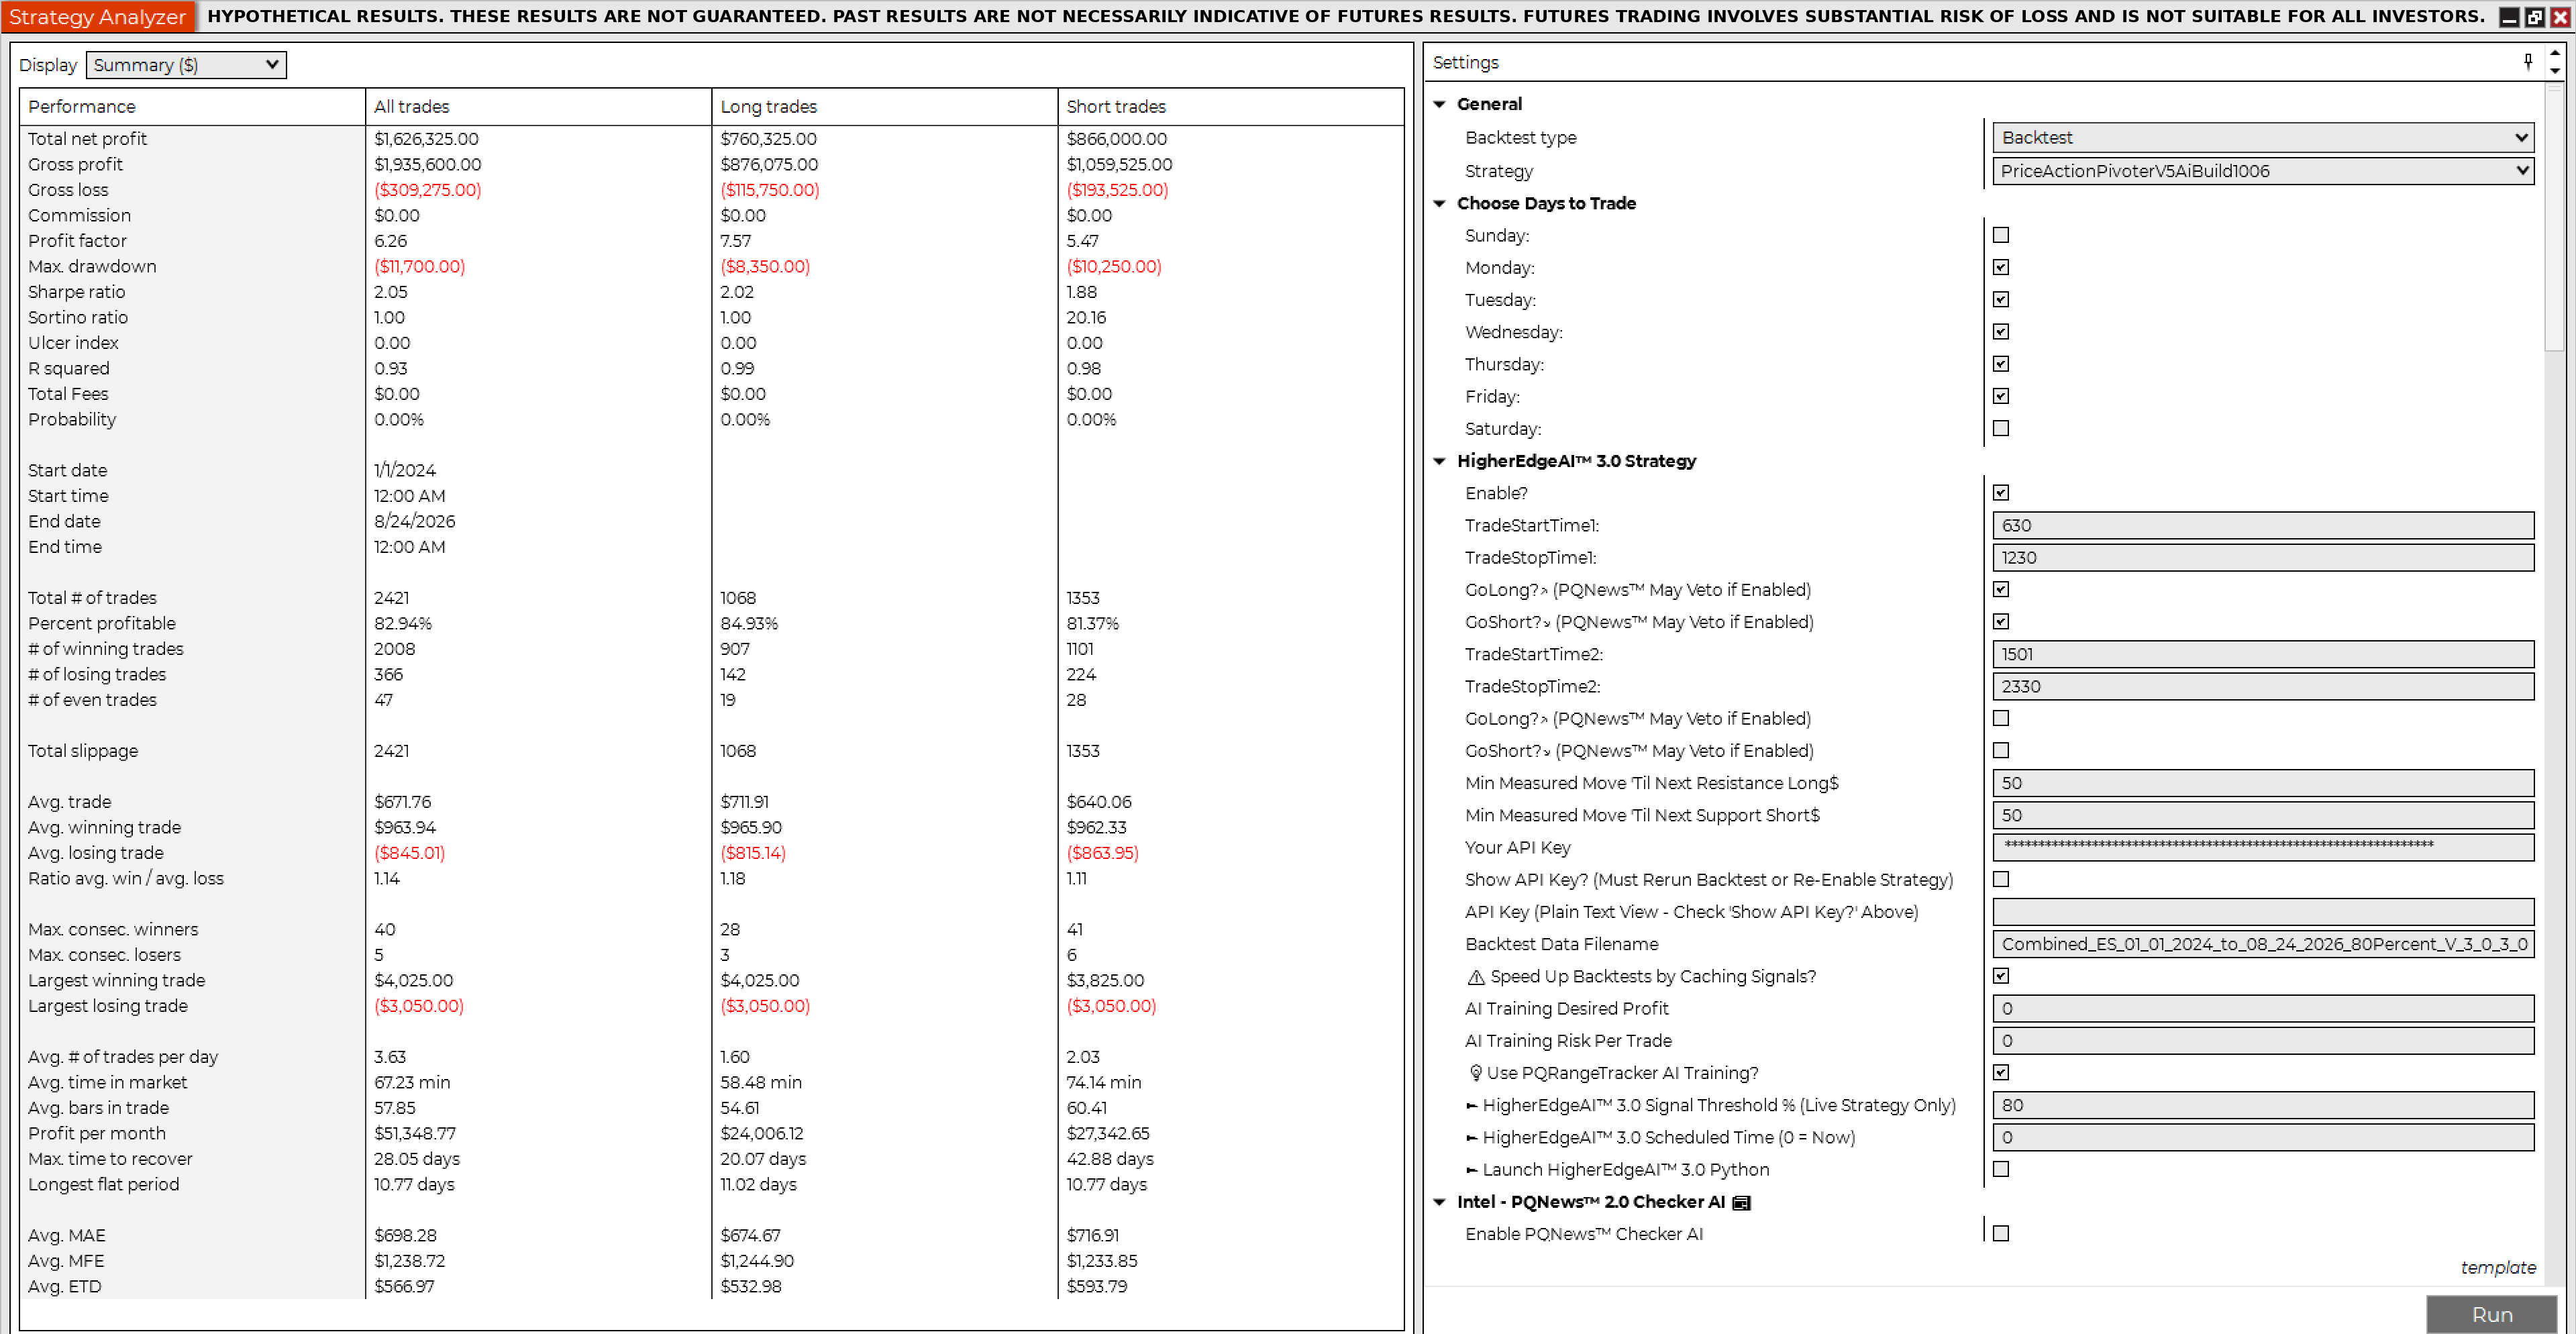
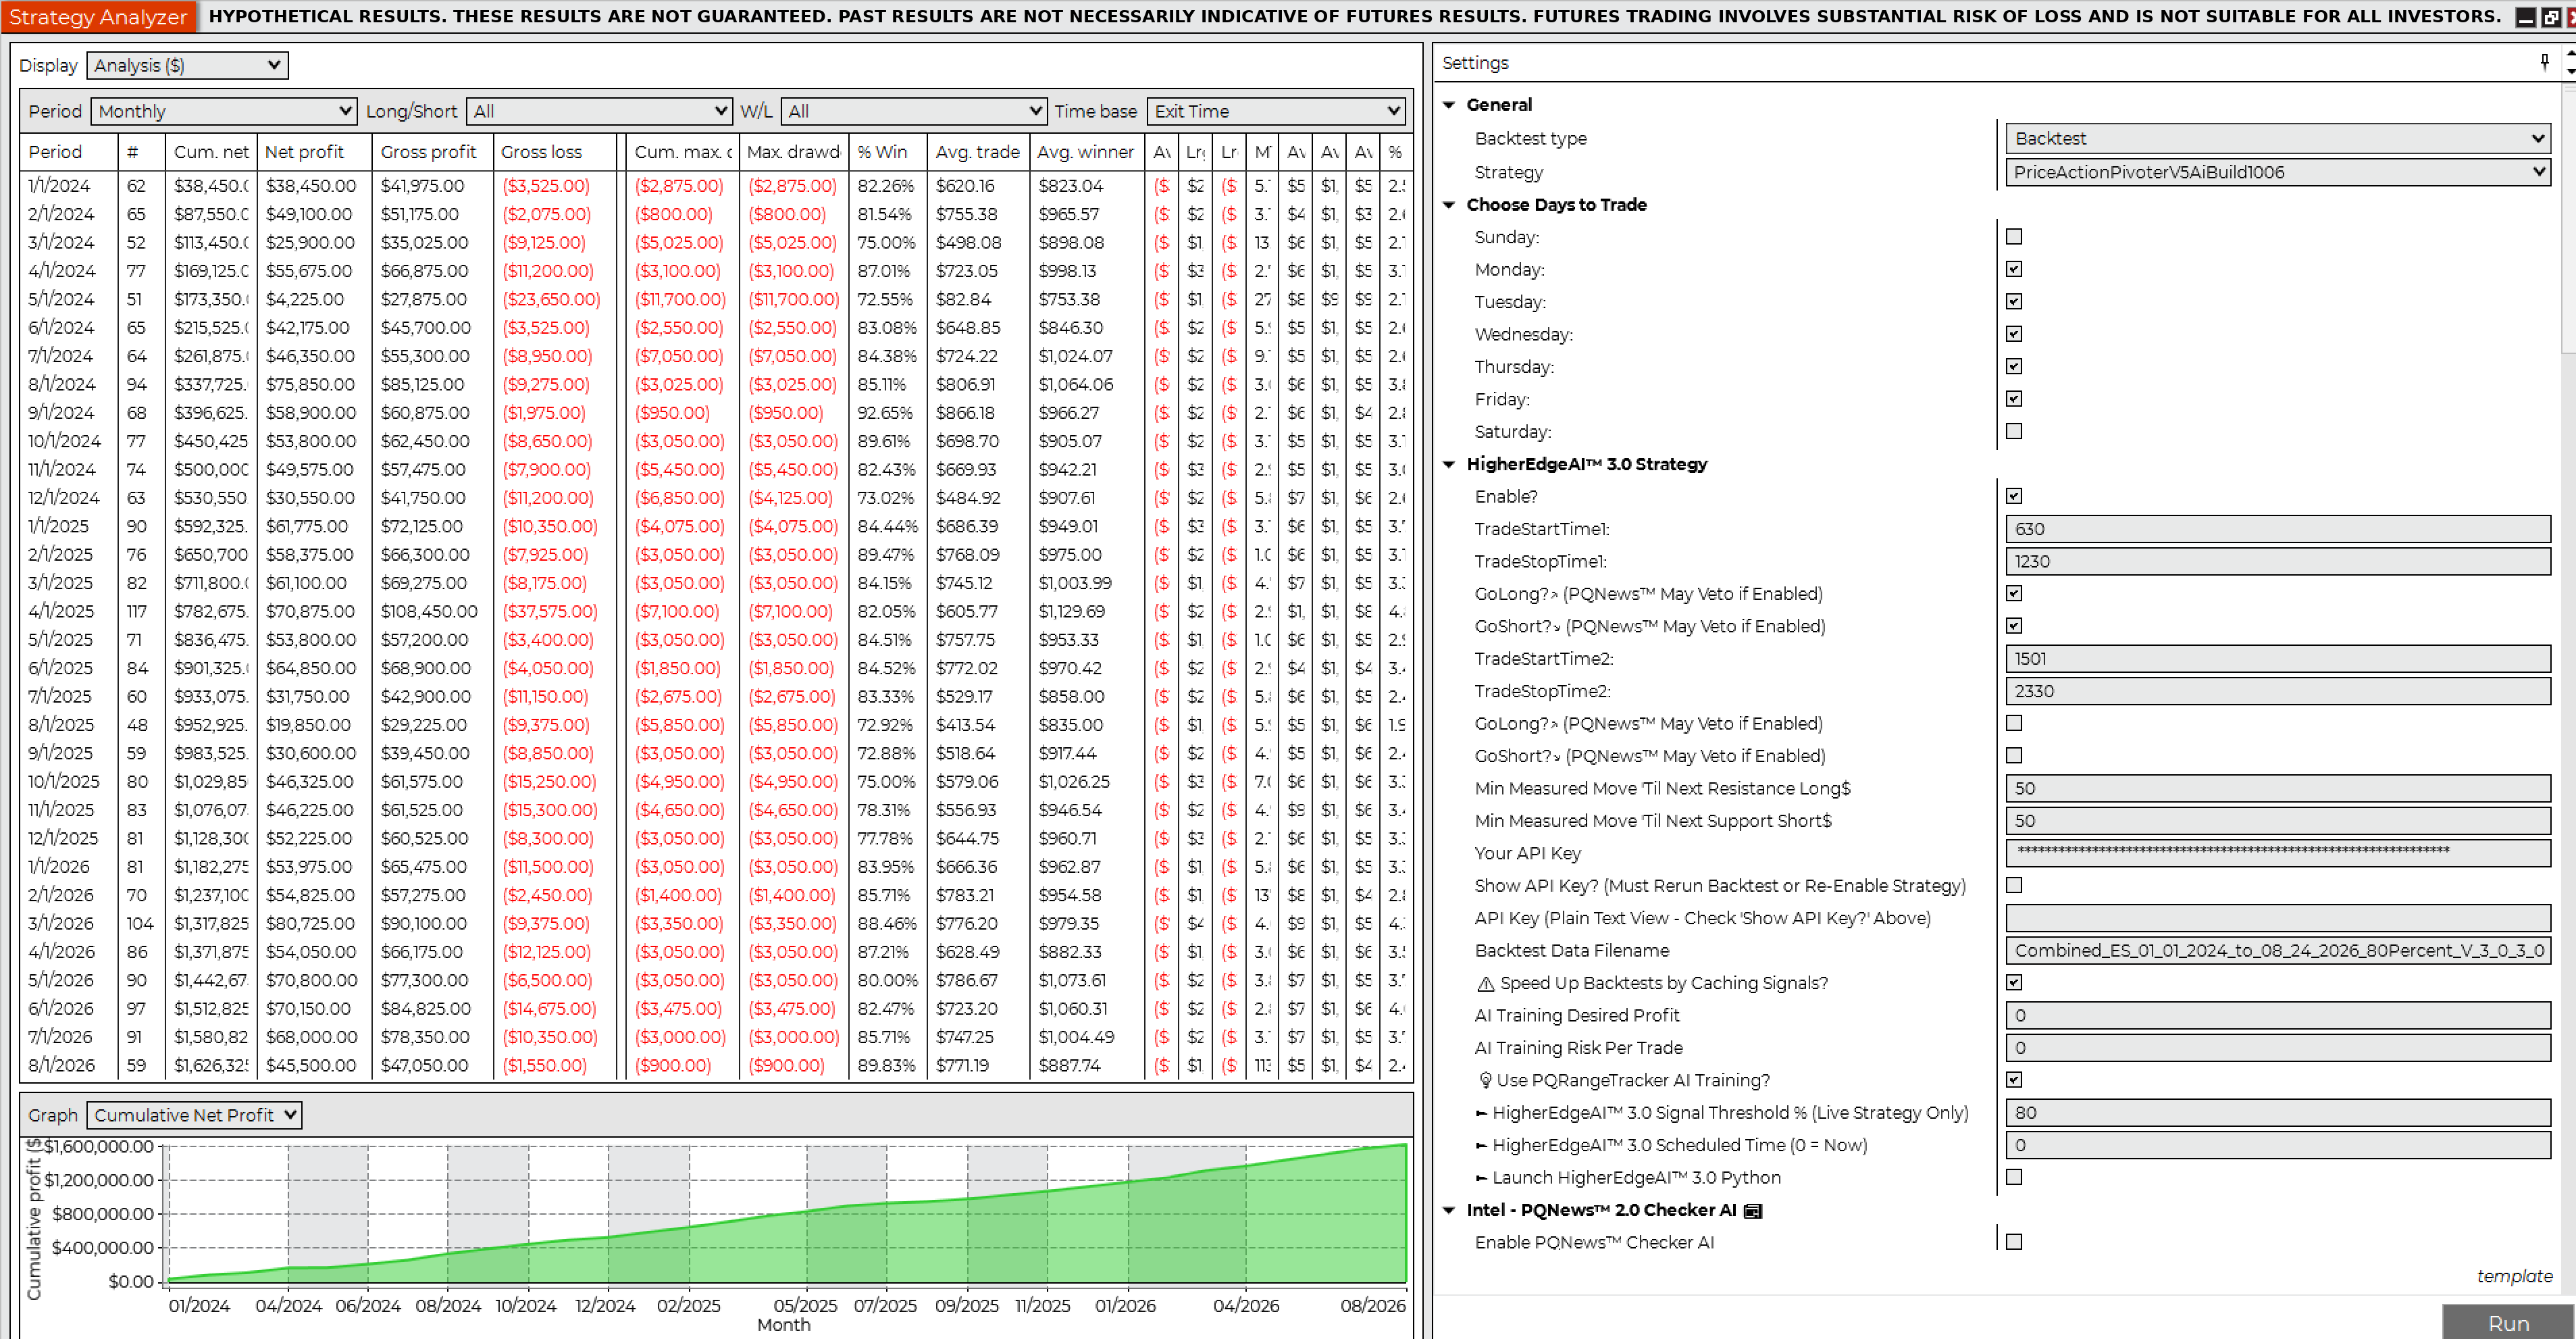
Backtest 2 · NinjaTrader Strategy AnalyzerES · 2 Contracts · 80% HigherEdgeAI™ 3.0 Confidence Threshold
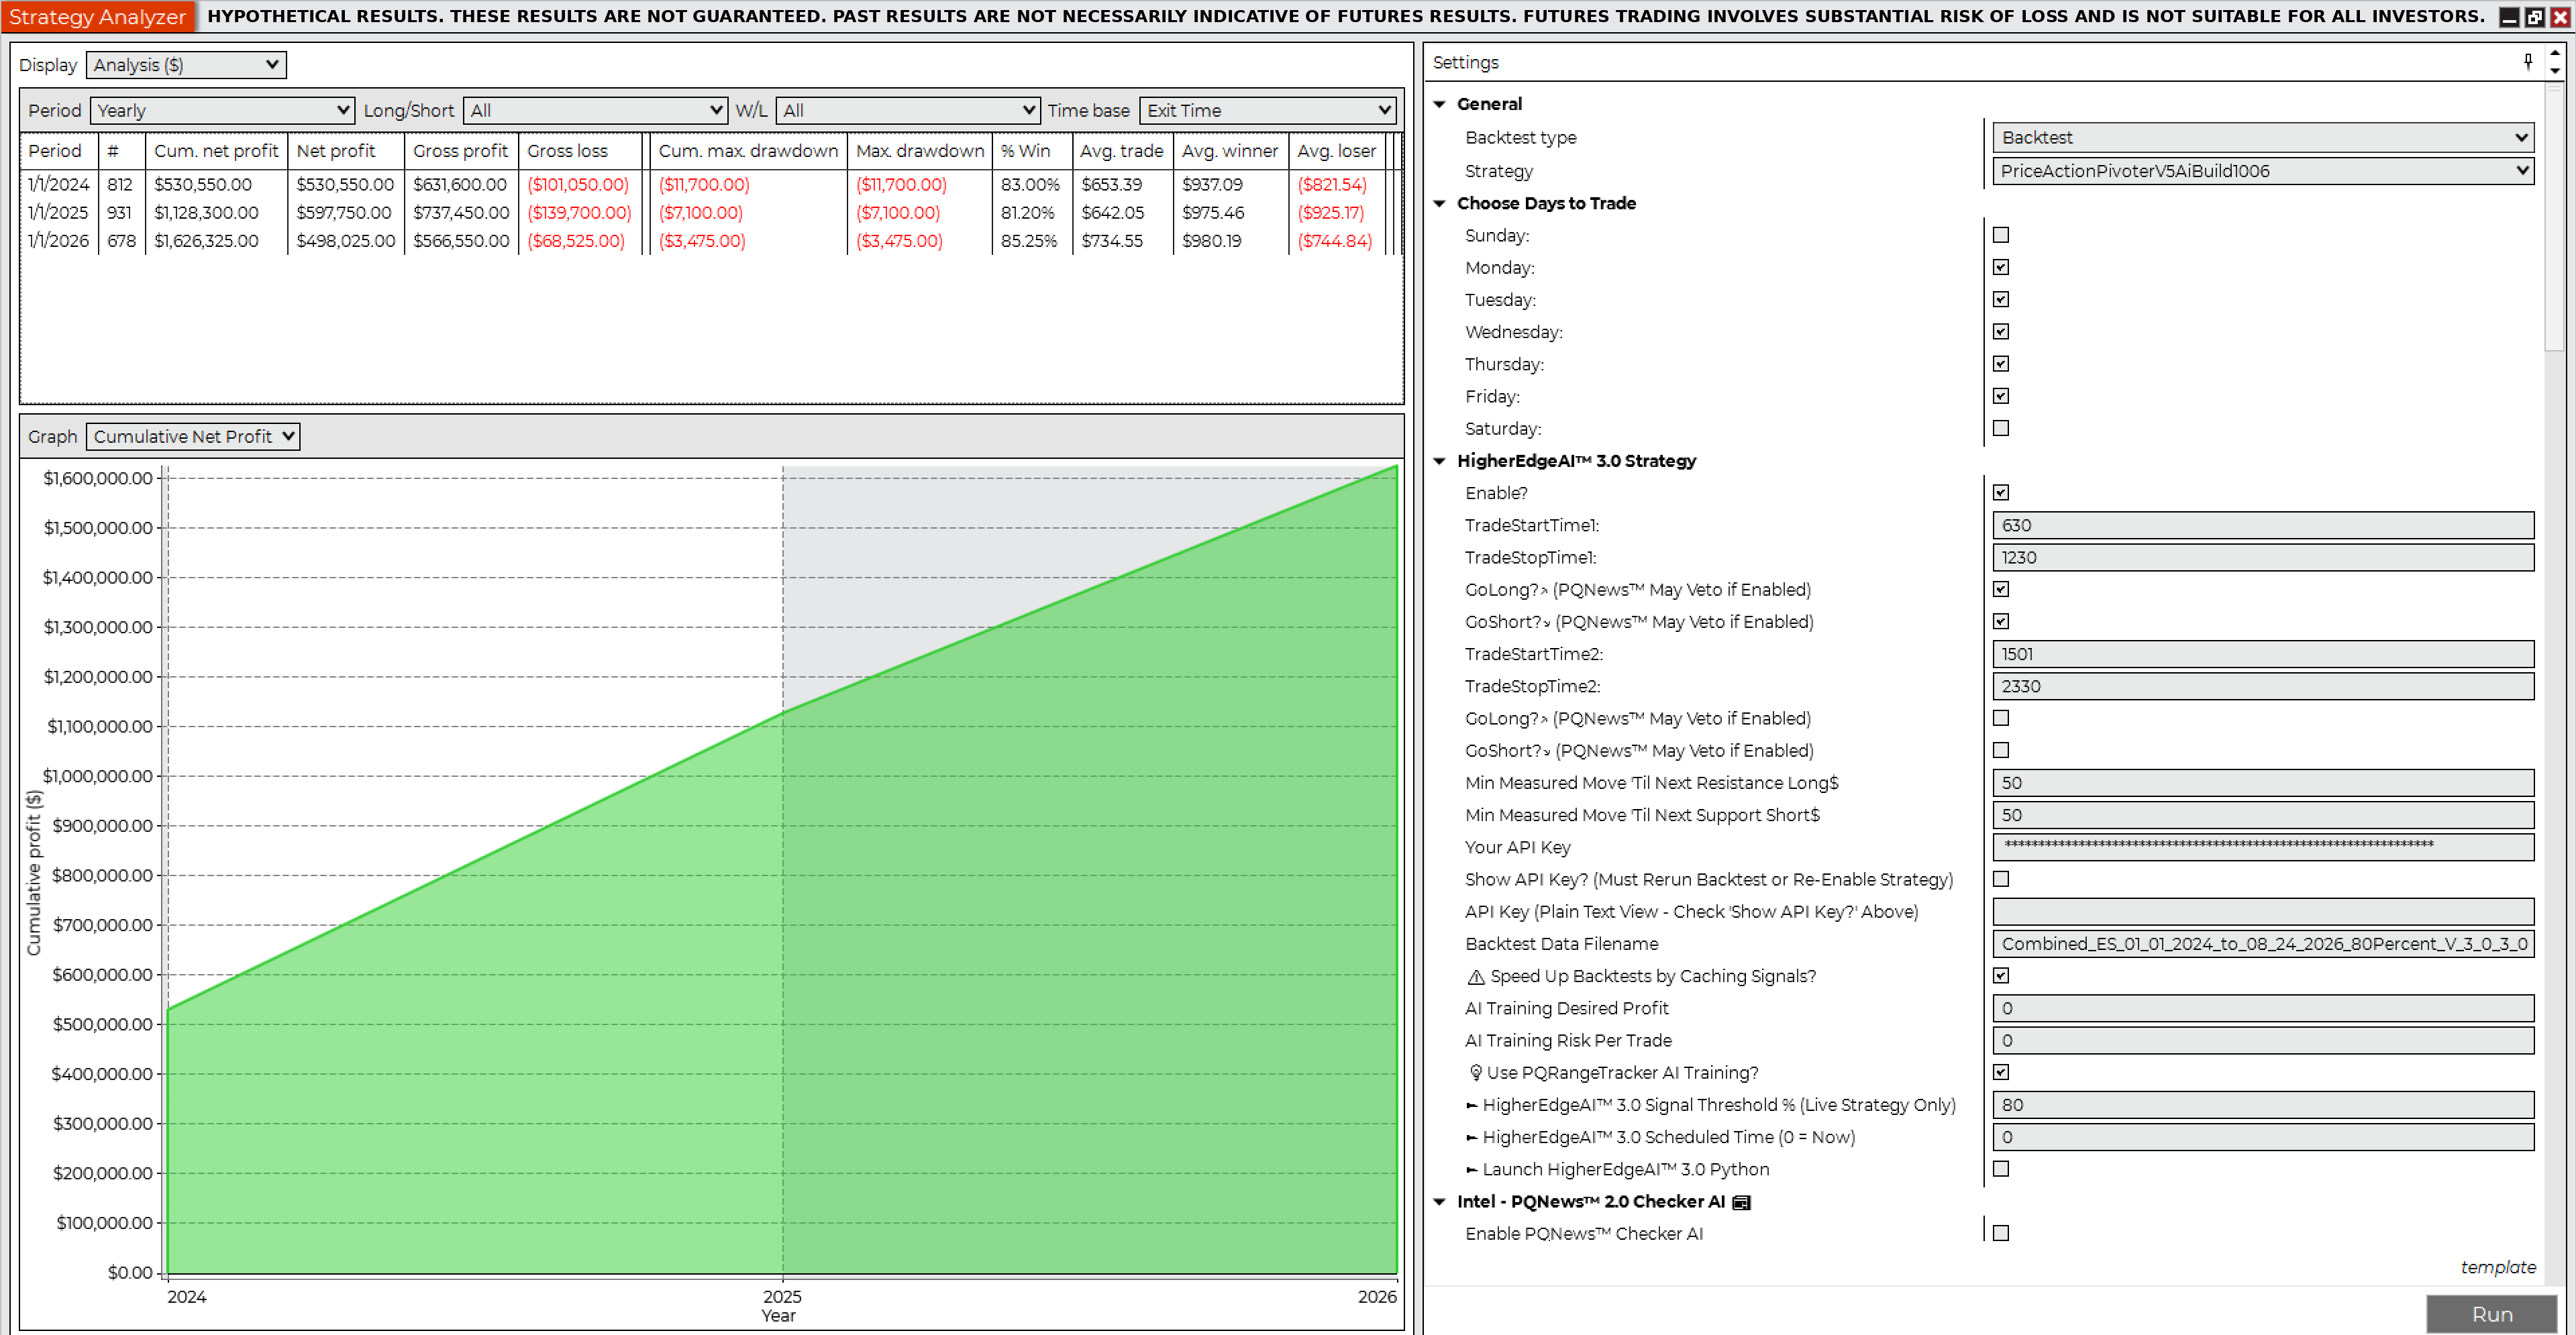
Hypothetical net profit$1,626,325.00

NinjaTrader Strategy Analyzer Summary, Backtest 2, ES 2 Contracts 80%NinjaTrader Strategy Analyzer Monthly, Backtest 2, ES 2 Contracts 80%NinjaTrader Strategy Analyzer Yearly, Backtest 2, ES 2 Contracts 80%

NinjaTrader trade details, Backtest 2
Net profit$1,626,325.00
Gross profit$1,935,600.00
Gross loss($309,275.00)
Profit factor6.26
Max drawdown($11,700.00)
Number of trades2,421
Win rate82.94%
Winning trades2,008
Losing trades366
Start date1/1/2024
End date8/24/2026
Hours traded6:30 AM – 12:30 PM Pacific
Flatten everything12:59 PM Pacific
Sortino ratio1.00
Sharpe ratio2.05
Average time in market67.23 min
Max time to recover28.05 days
Longest flat period10.77 days
Average MAE$698.28
Average MFE$1,238.72
Market conditionAll, incl. economic news events
Contracts2
Slippage2 ticks
CommissionNot included; e.g. $10 × 2,421 = $24,210
Backtest 3 · NinjaTrader Strategy AnalyzerES · 1 Contract · 90% HigherEdgeAI™ 3.0 Confidence Threshold
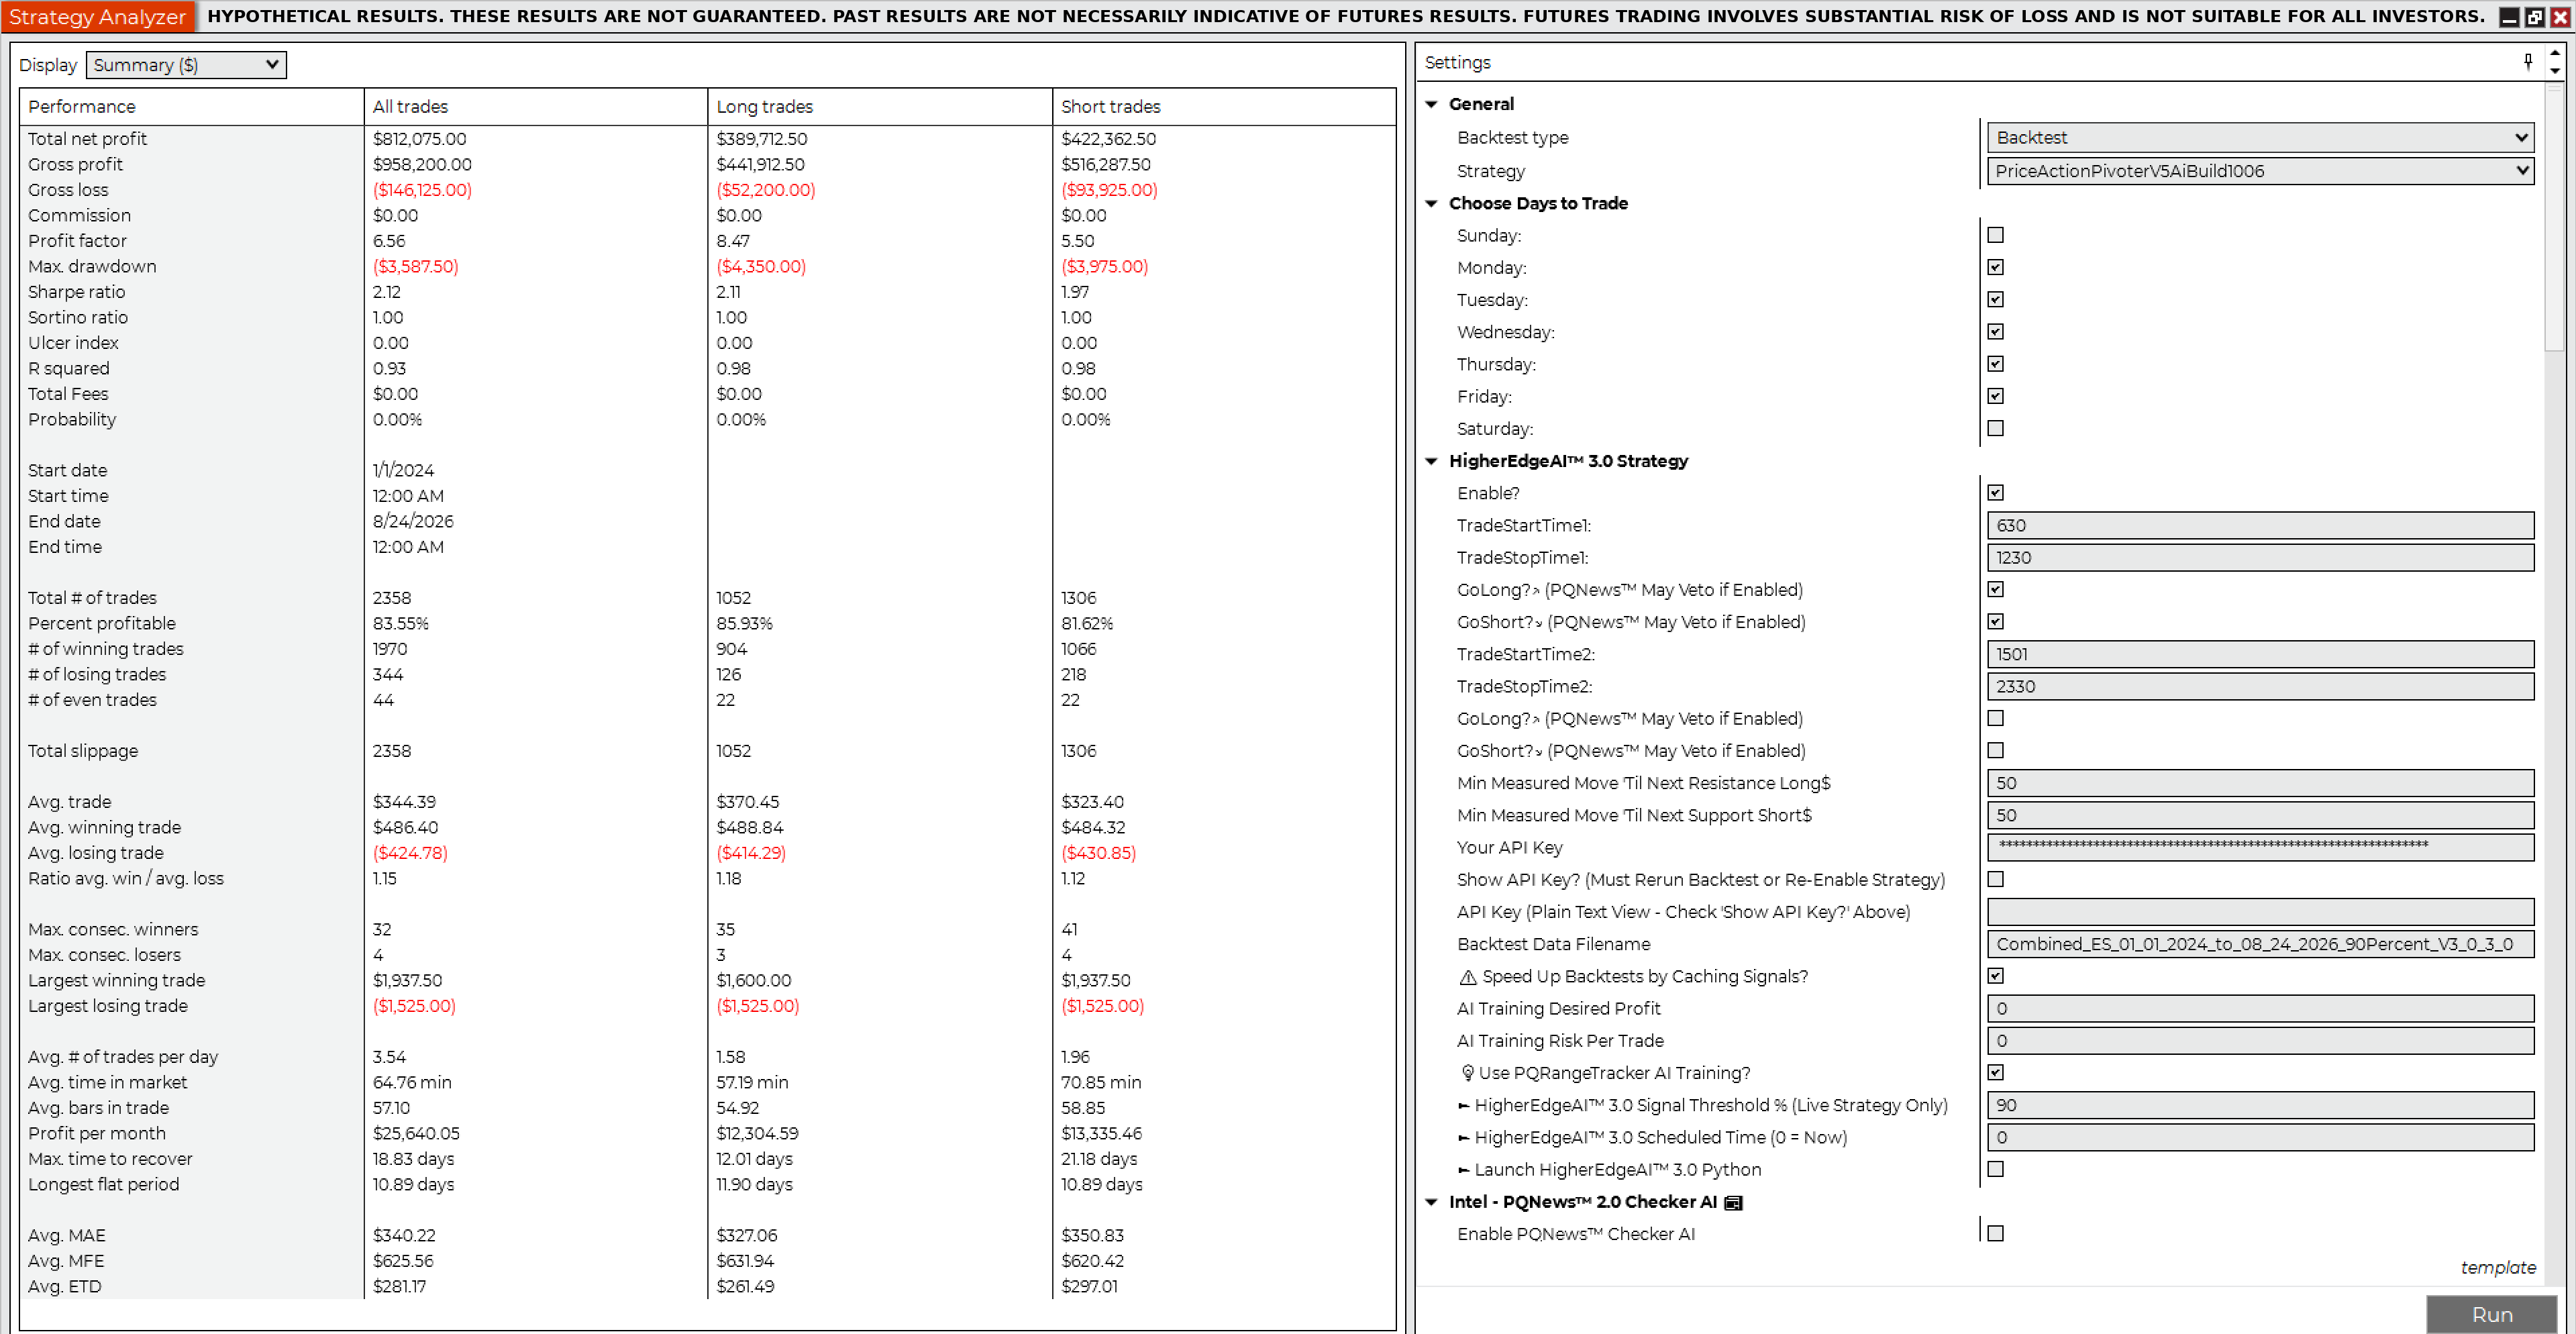
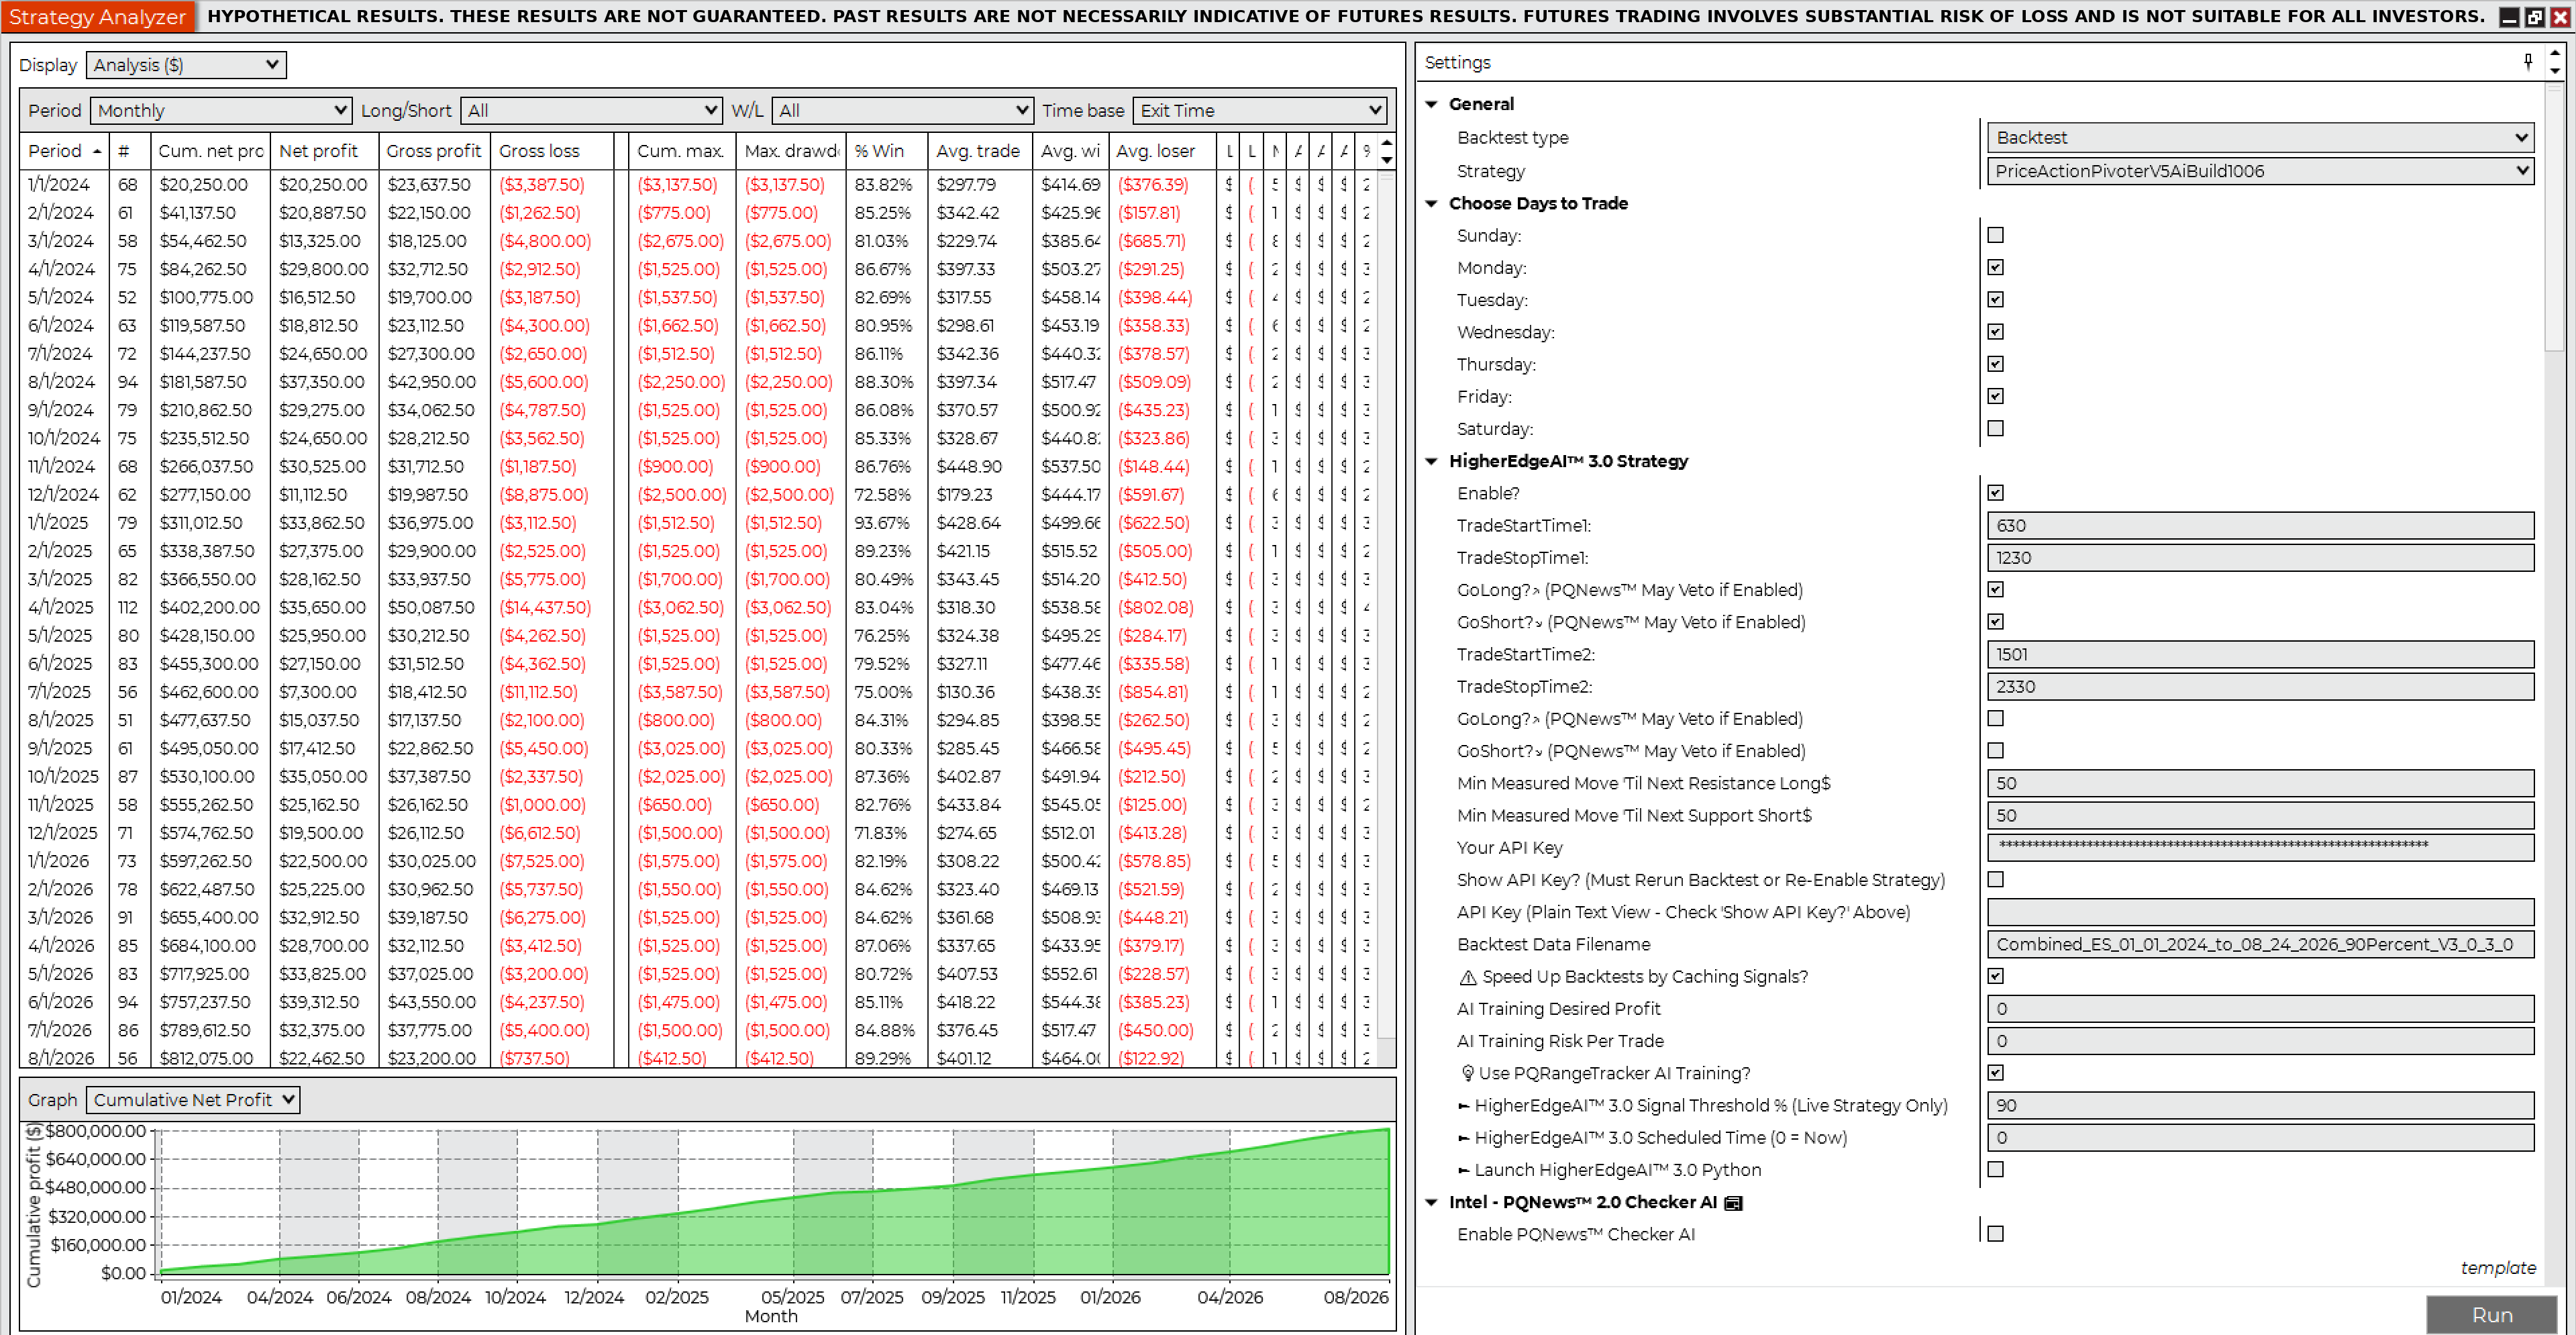
Hypothetical net profit$812,075.00

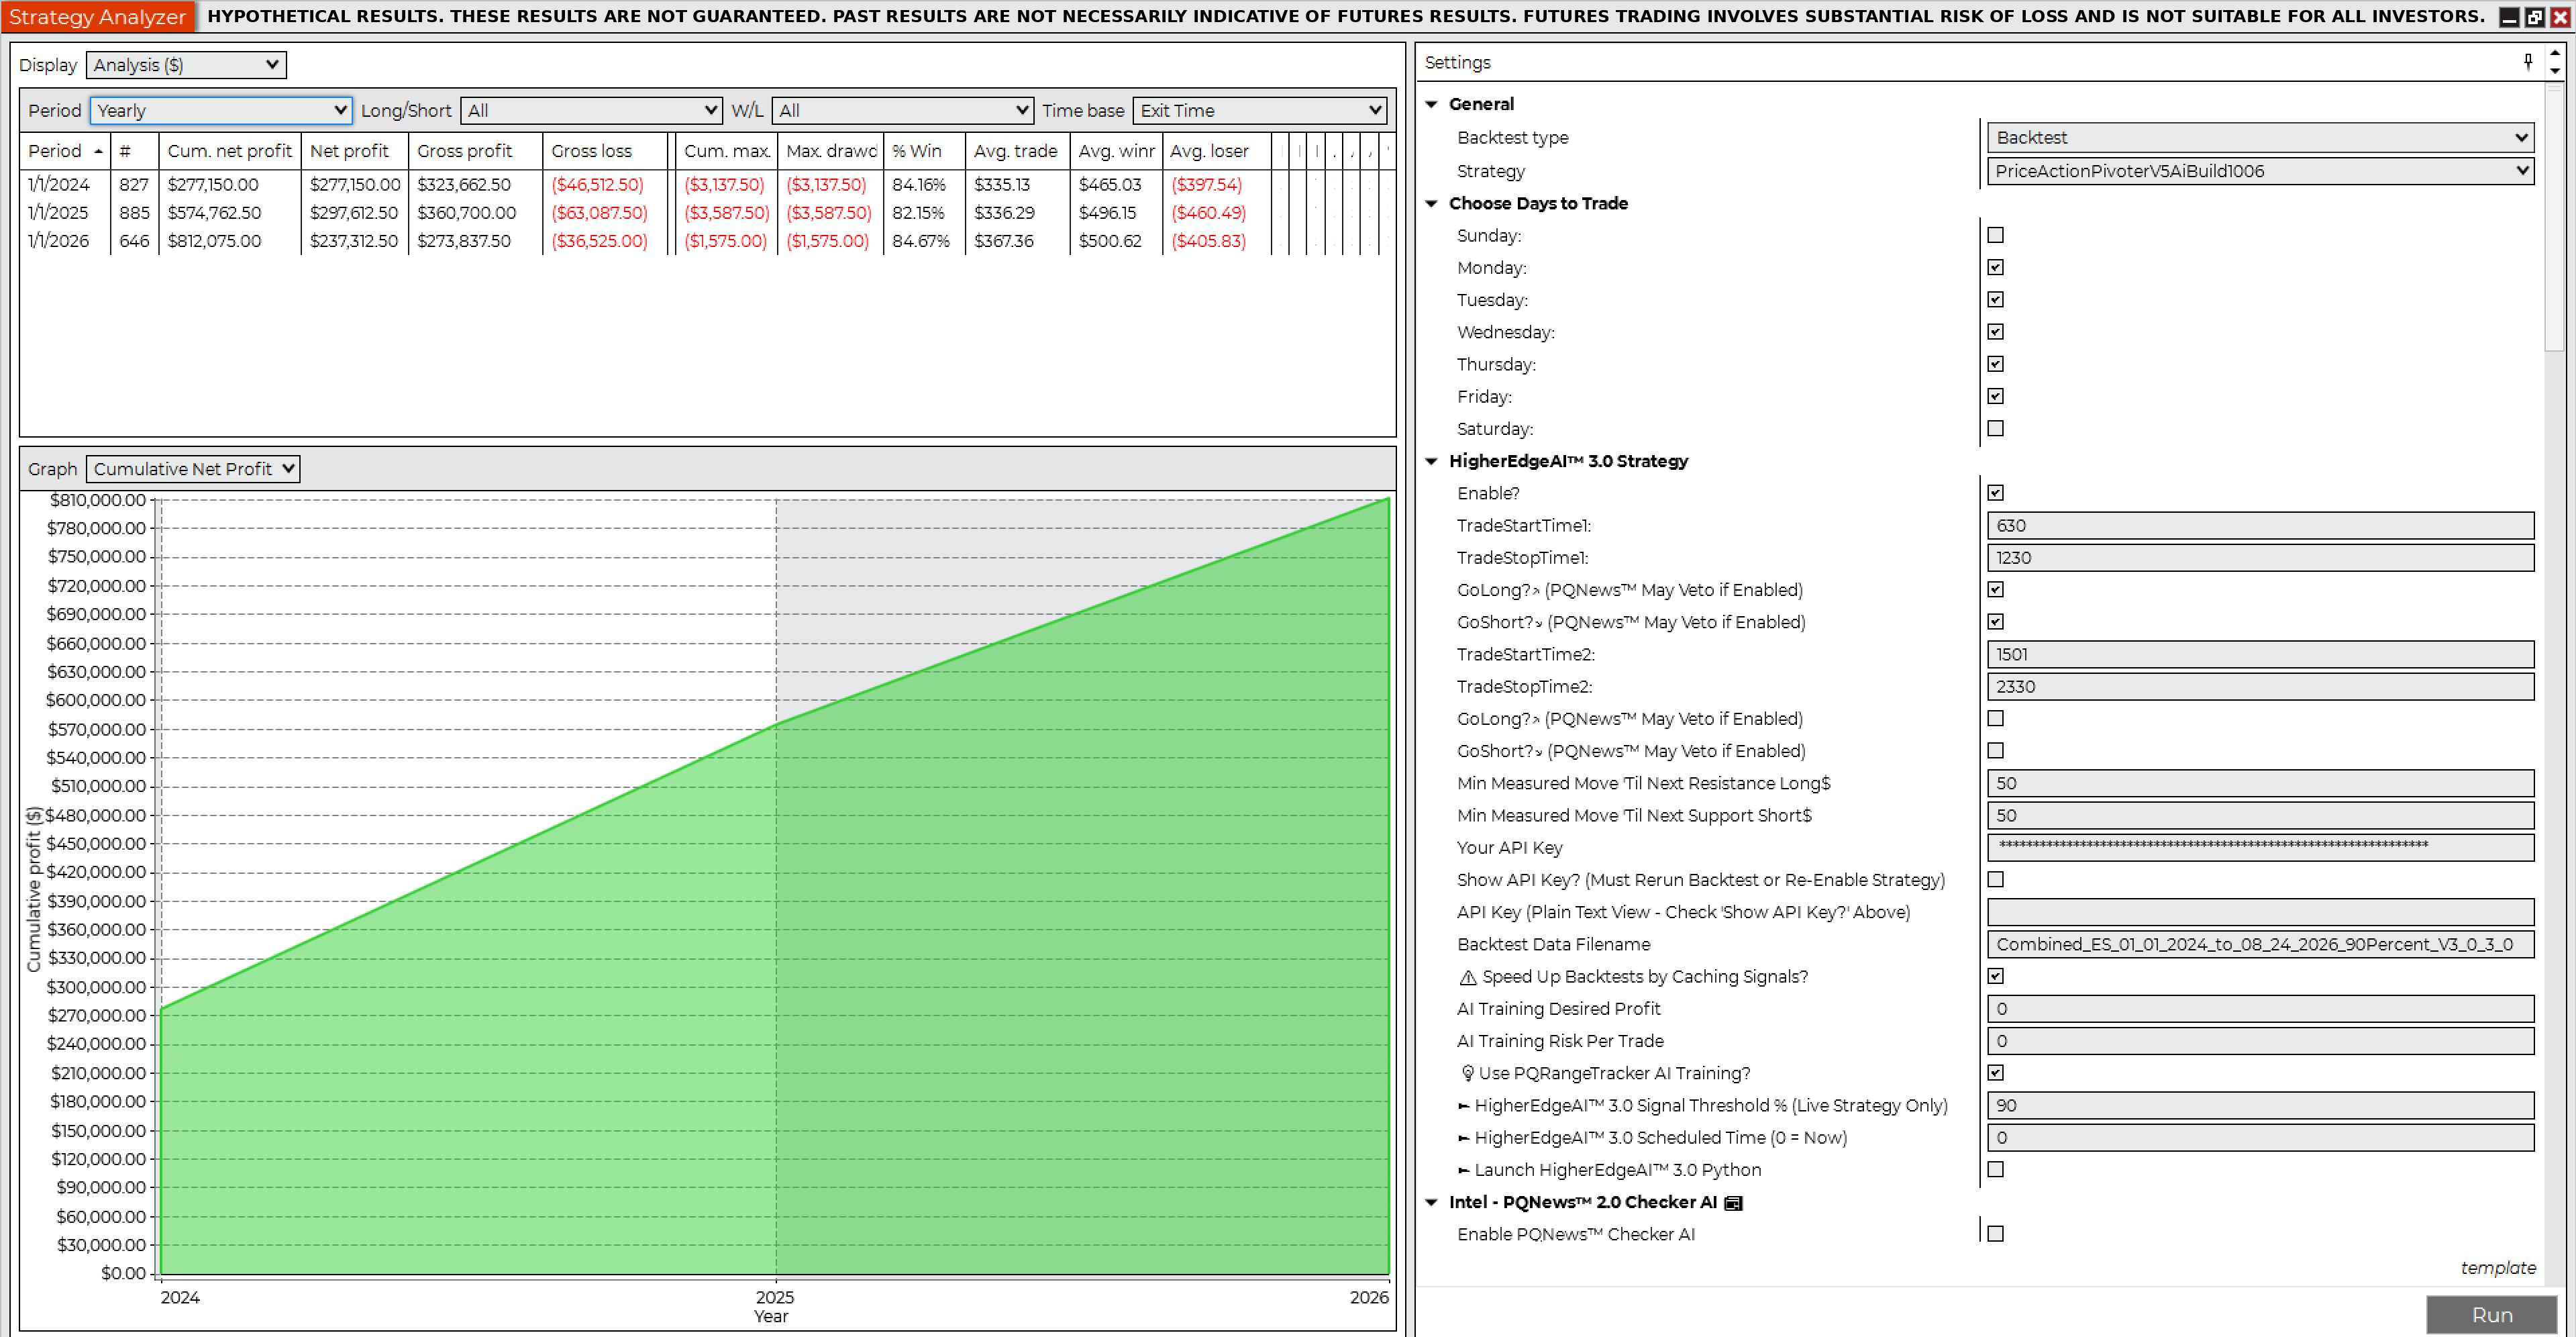
NinjaTrader Strategy Analyzer Summary, Backtest 3, ES 1 Contract 90%NinjaTrader Strategy Analyzer Monthly, Backtest 3, ES 1 Contract 90%NinjaTrader Strategy Analyzer Yearly, Backtest 3, ES 1 Contract 90%

NinjaTrader trade details, Backtest 3
Net profit$812,075.00
Gross profit$958,200.00
Gross loss($146,125.00)
Profit factor6.56
Max drawdown($3,587.50)
Number of trades2,358
Win rate83.55%
Winning trades1,970
Losing trades344
Start date1/1/2024
End date8/24/2026
Hours traded6:30 AM – 12:30 PM Pacific
Flatten everything12:59 PM Pacific
Sortino ratio1.00
Sharpe ratio2.12
Average time in market64.76 min
Max time to recover18.83 days
Longest flat period10.89 days
Average MAE$340.22
Average MFE$625.56
Market conditionAll, incl. economic news events
Contracts1
Slippage2 ticks
CommissionNot included; e.g. $5 × 2,358 = $11,790
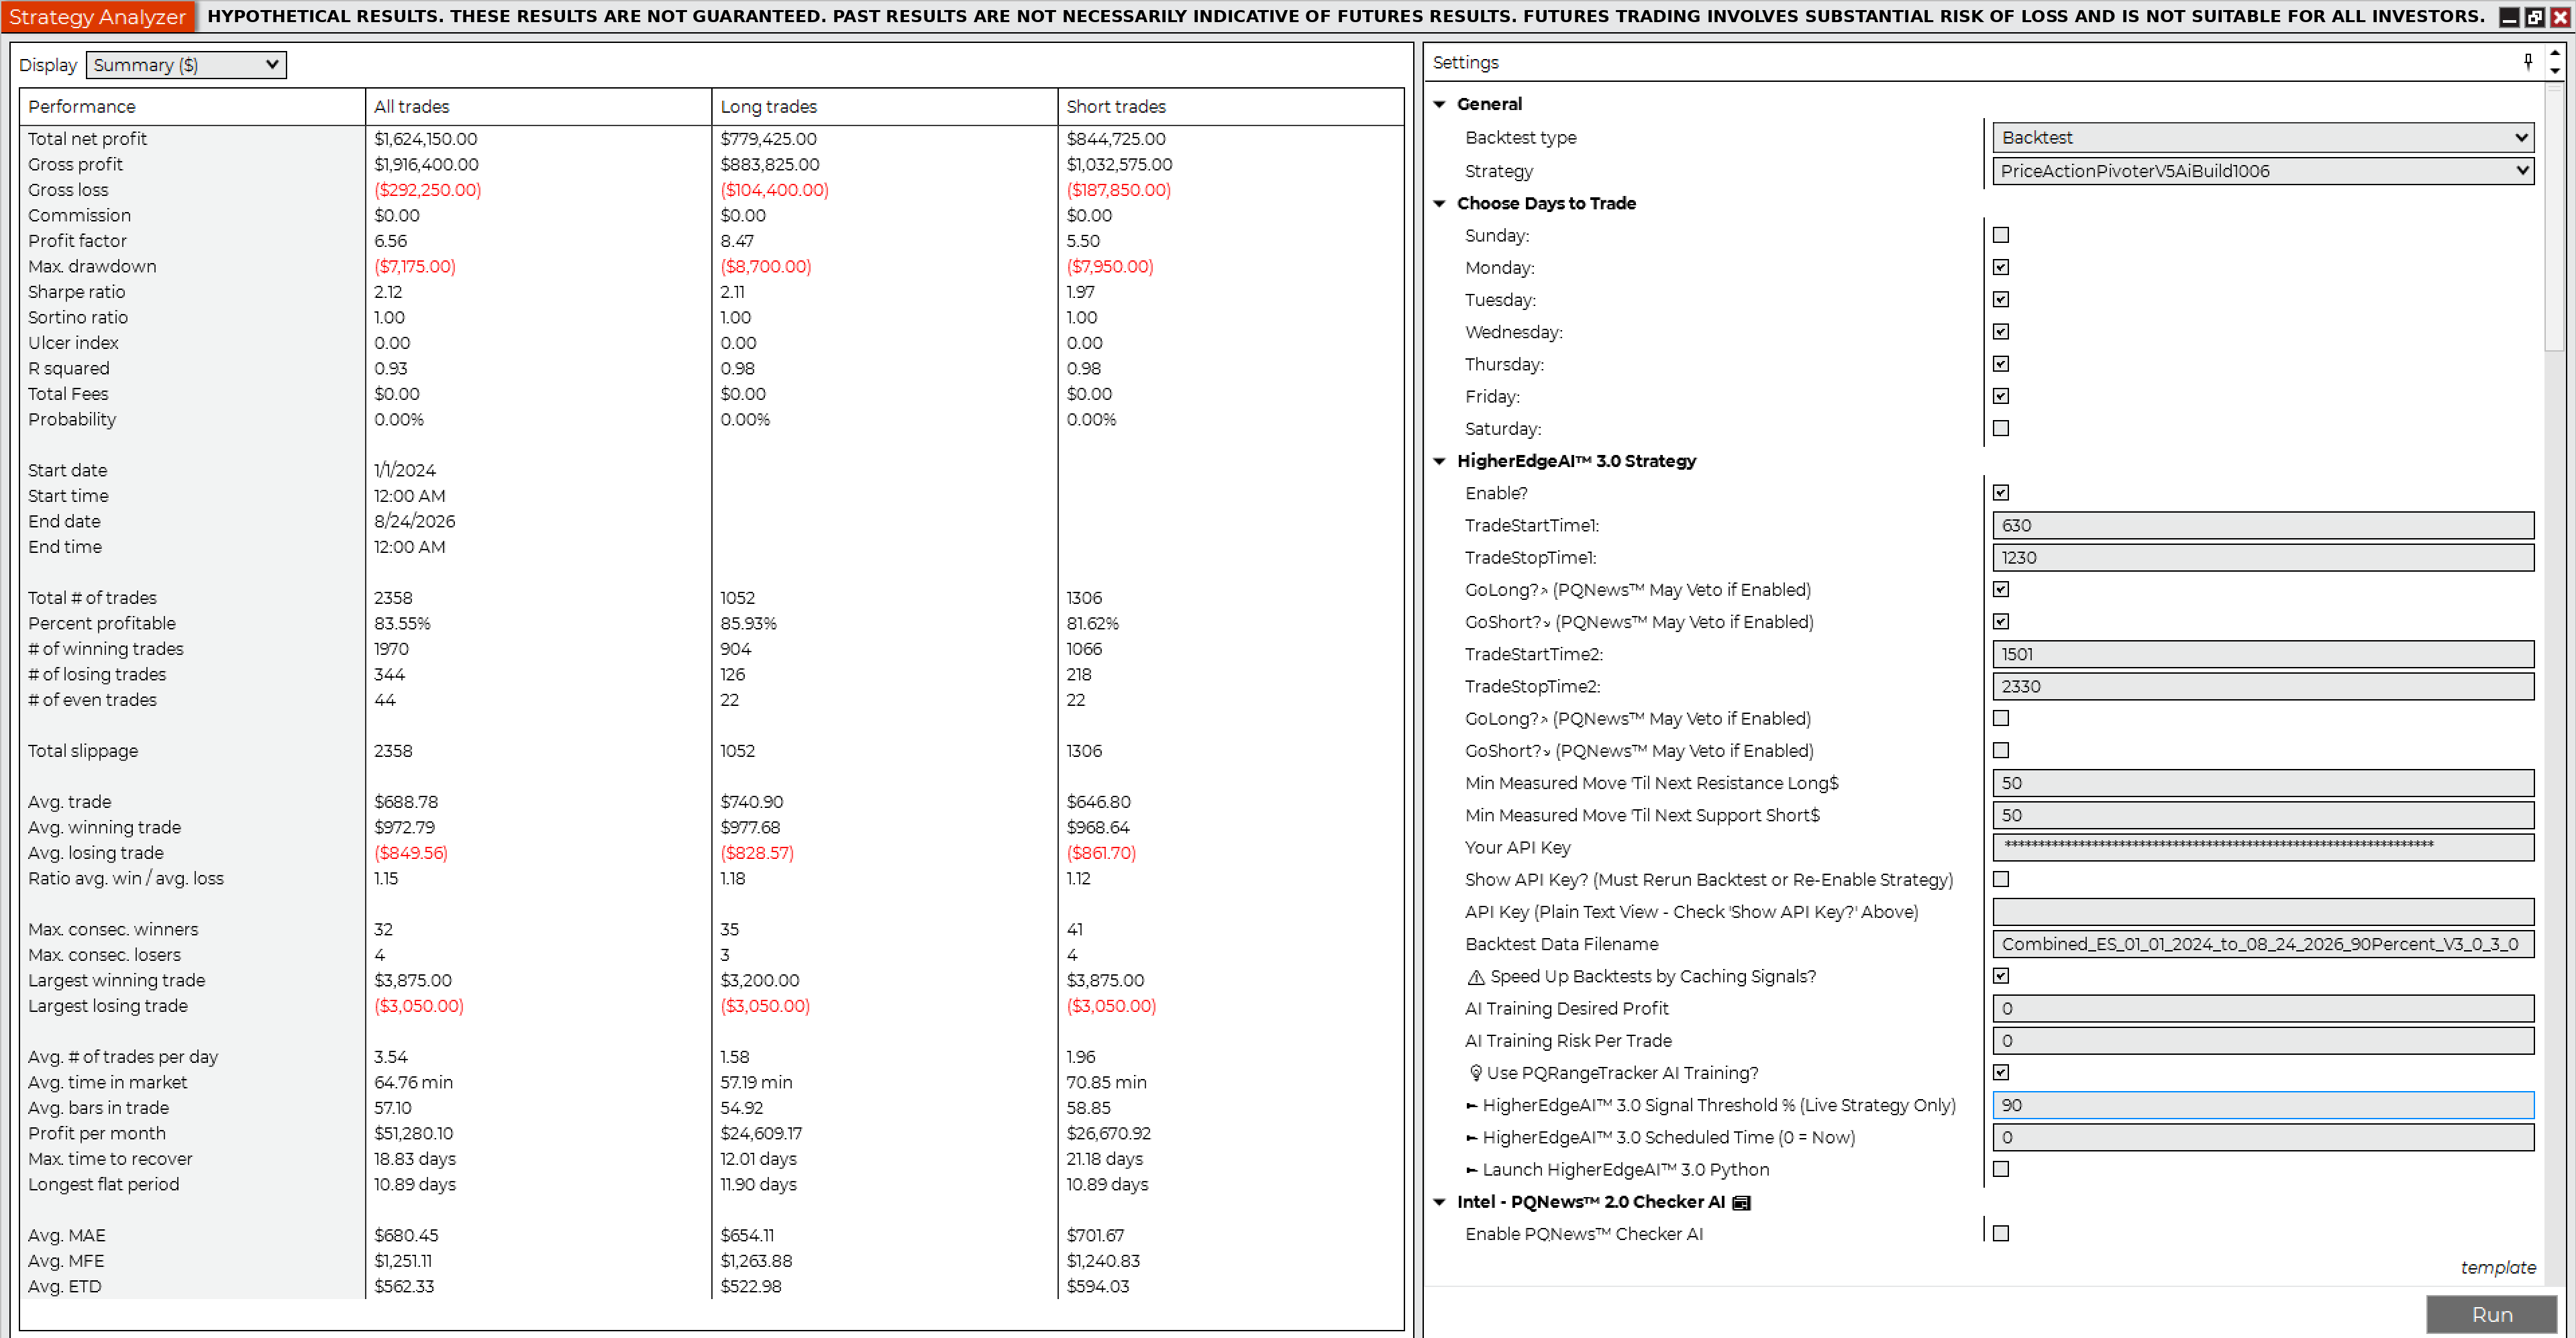
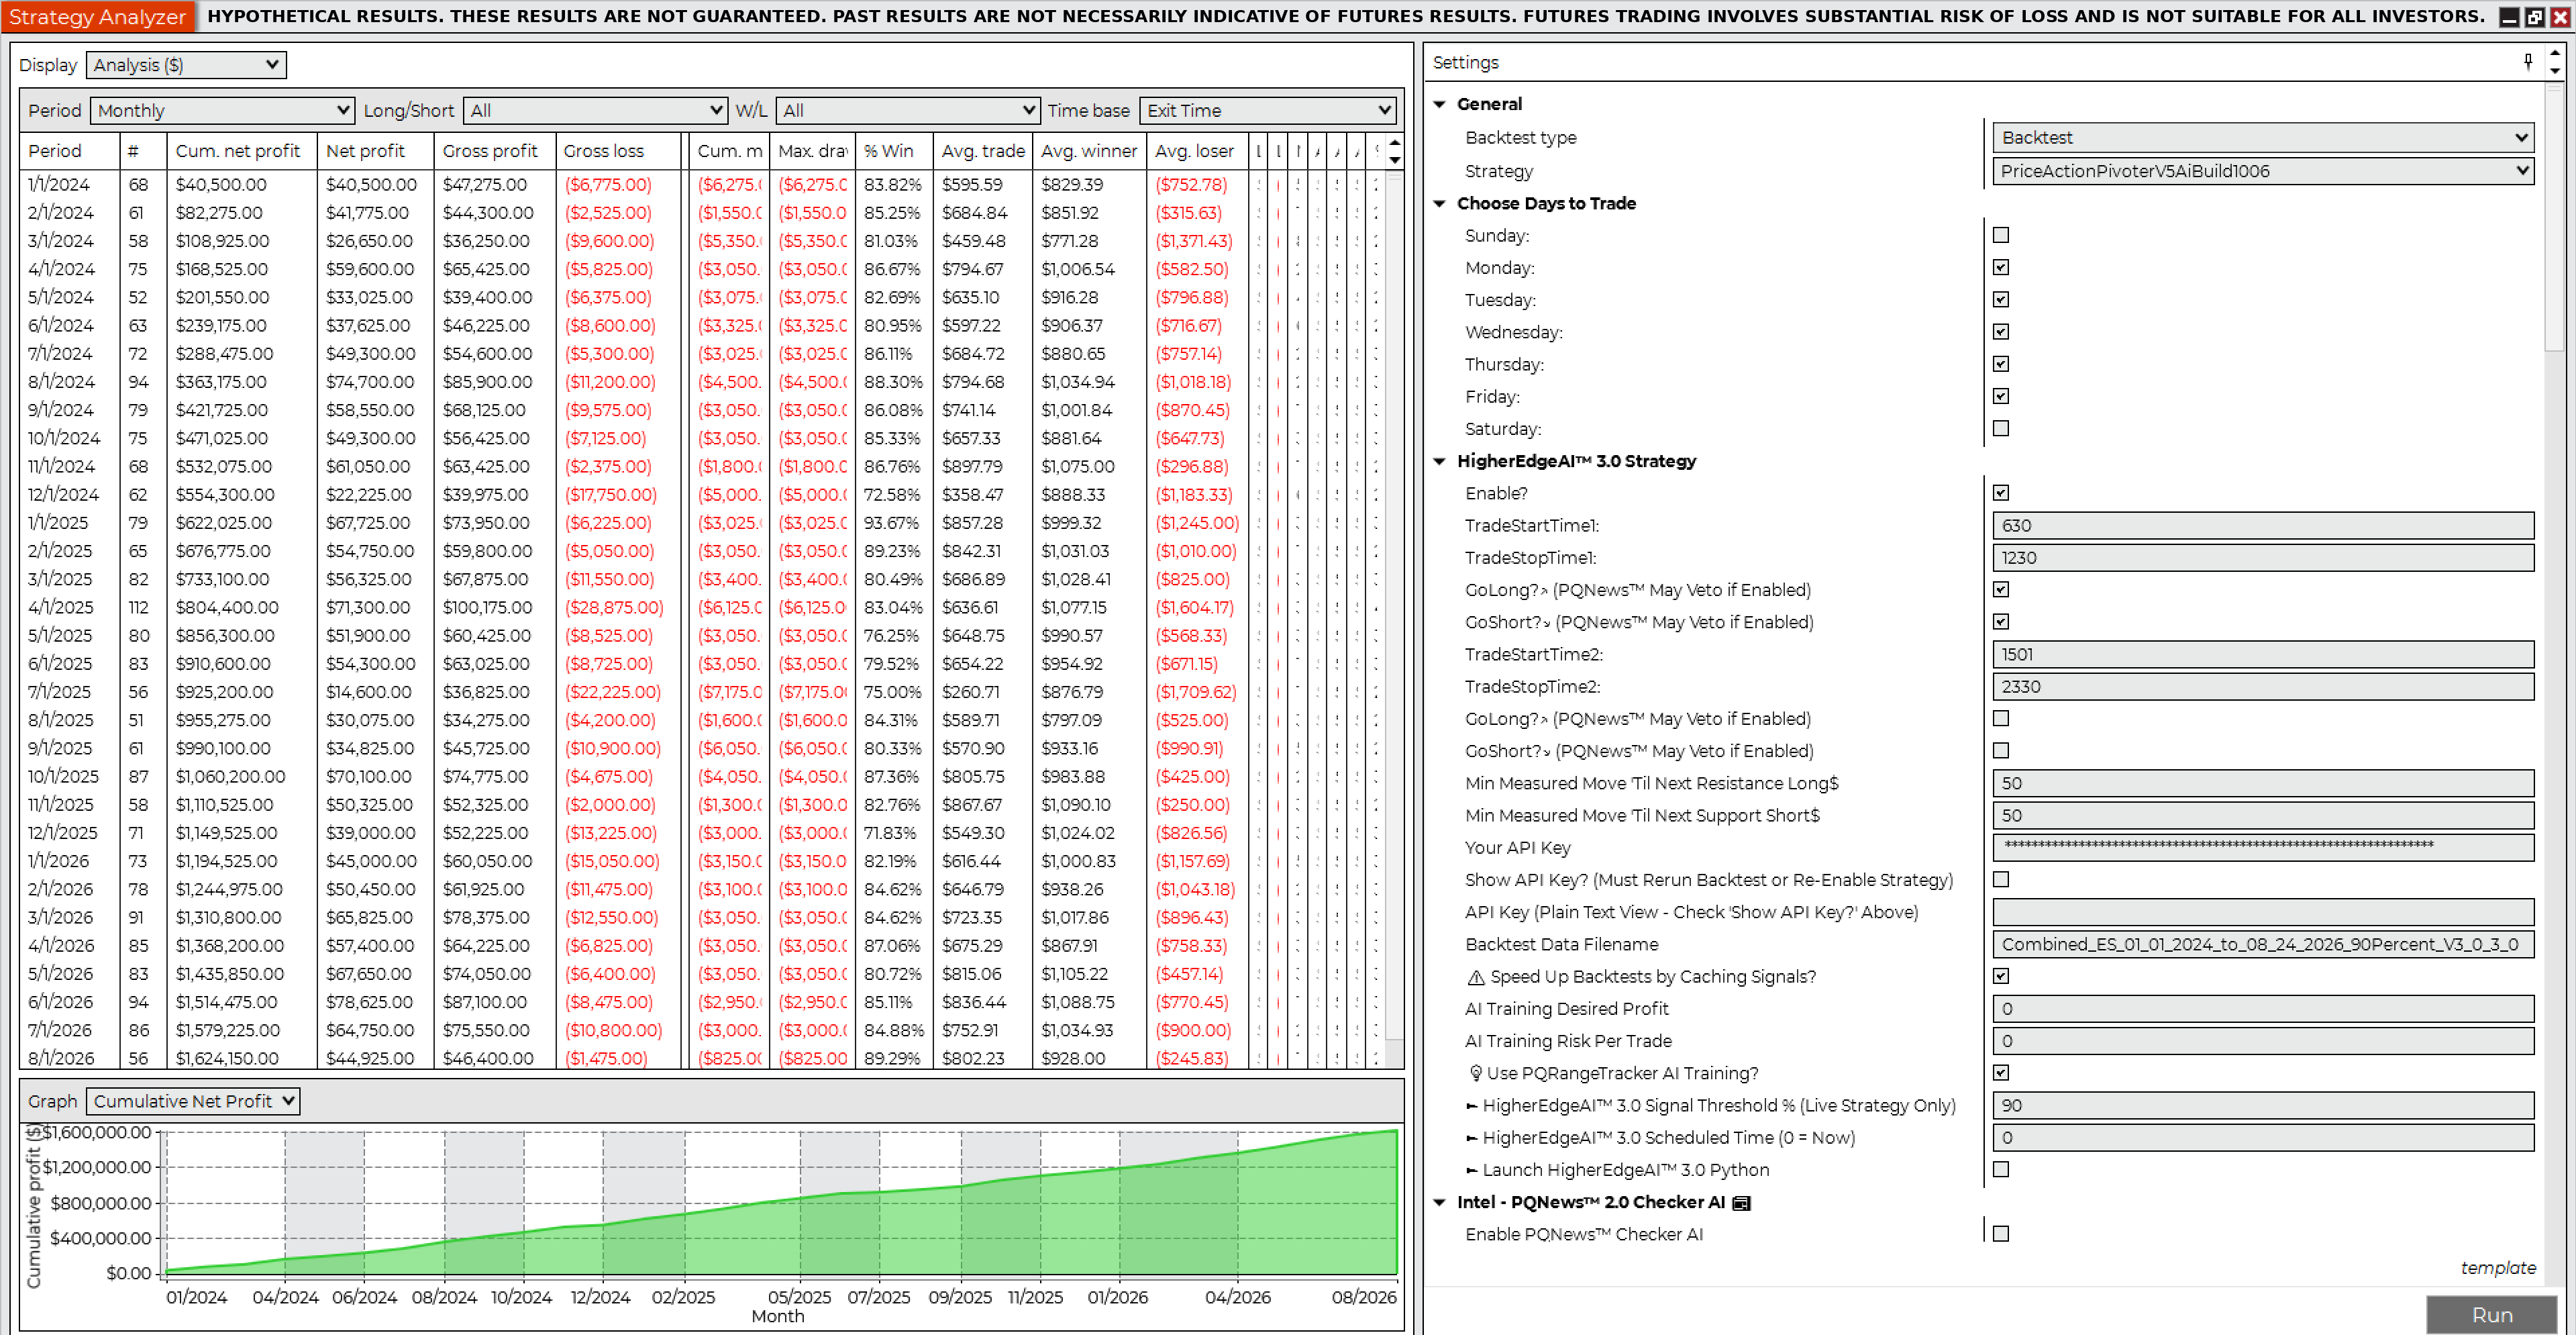
Backtest 4 · NinjaTrader Strategy AnalyzerES · 2 Contracts · 90% HigherEdgeAI™ 3.0 Confidence Threshold
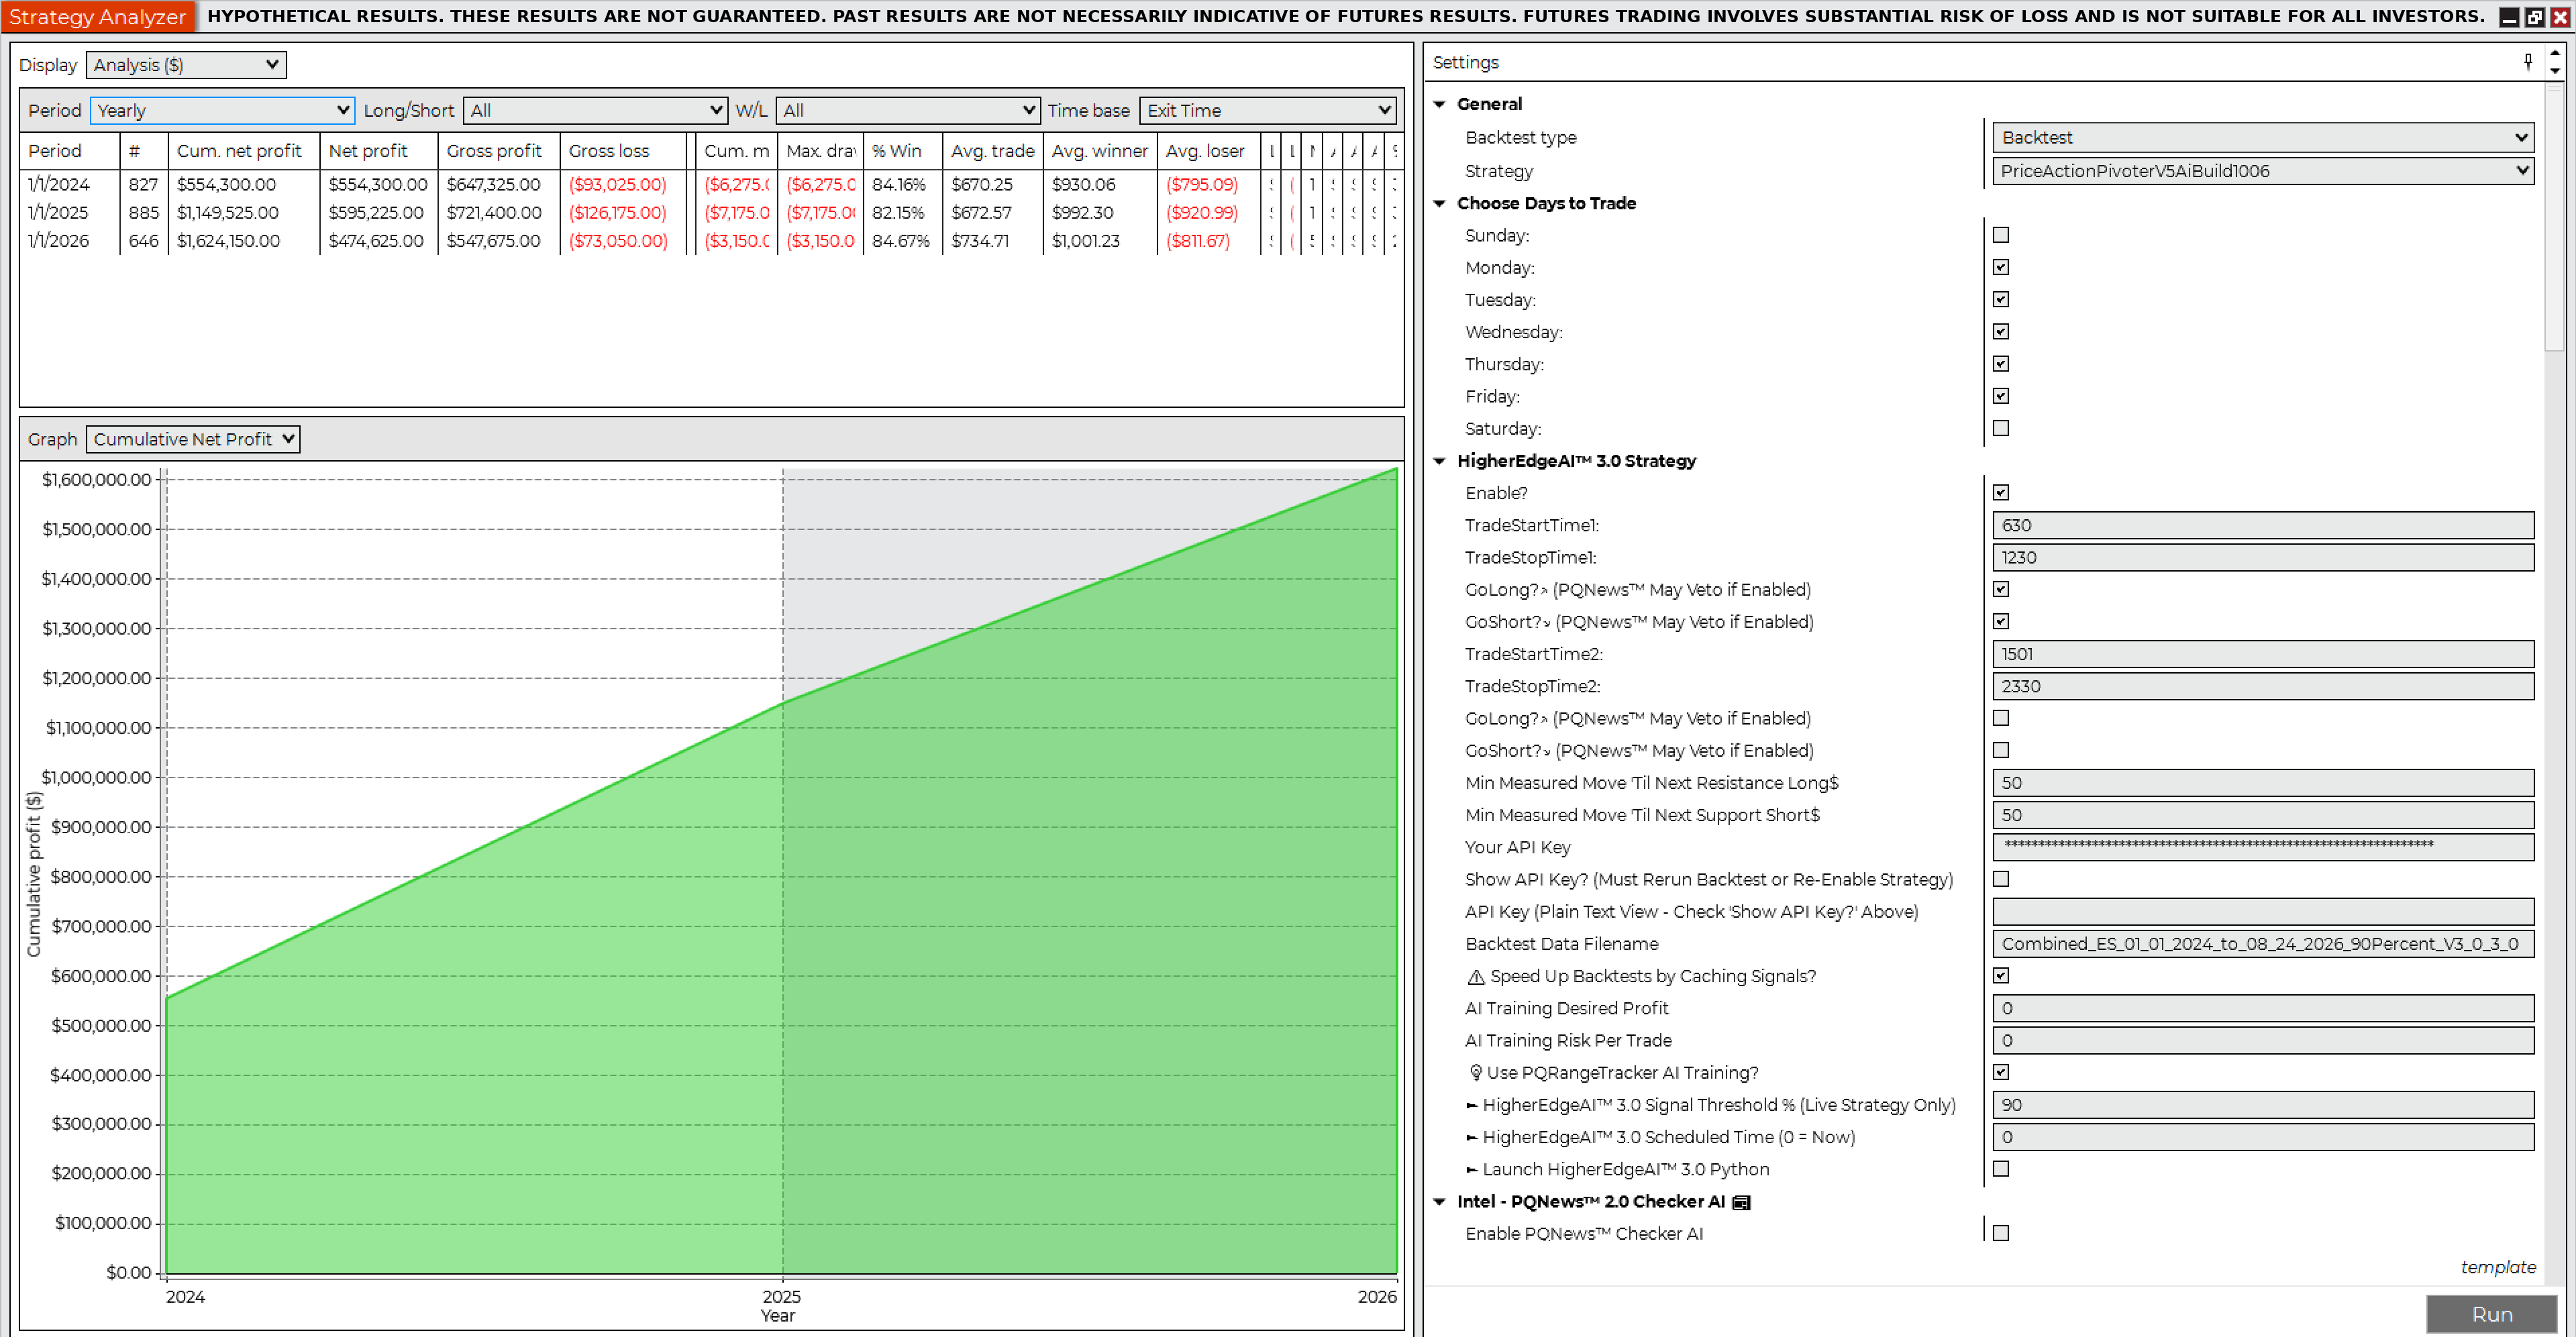
Hypothetical net profit$1,624,150.00

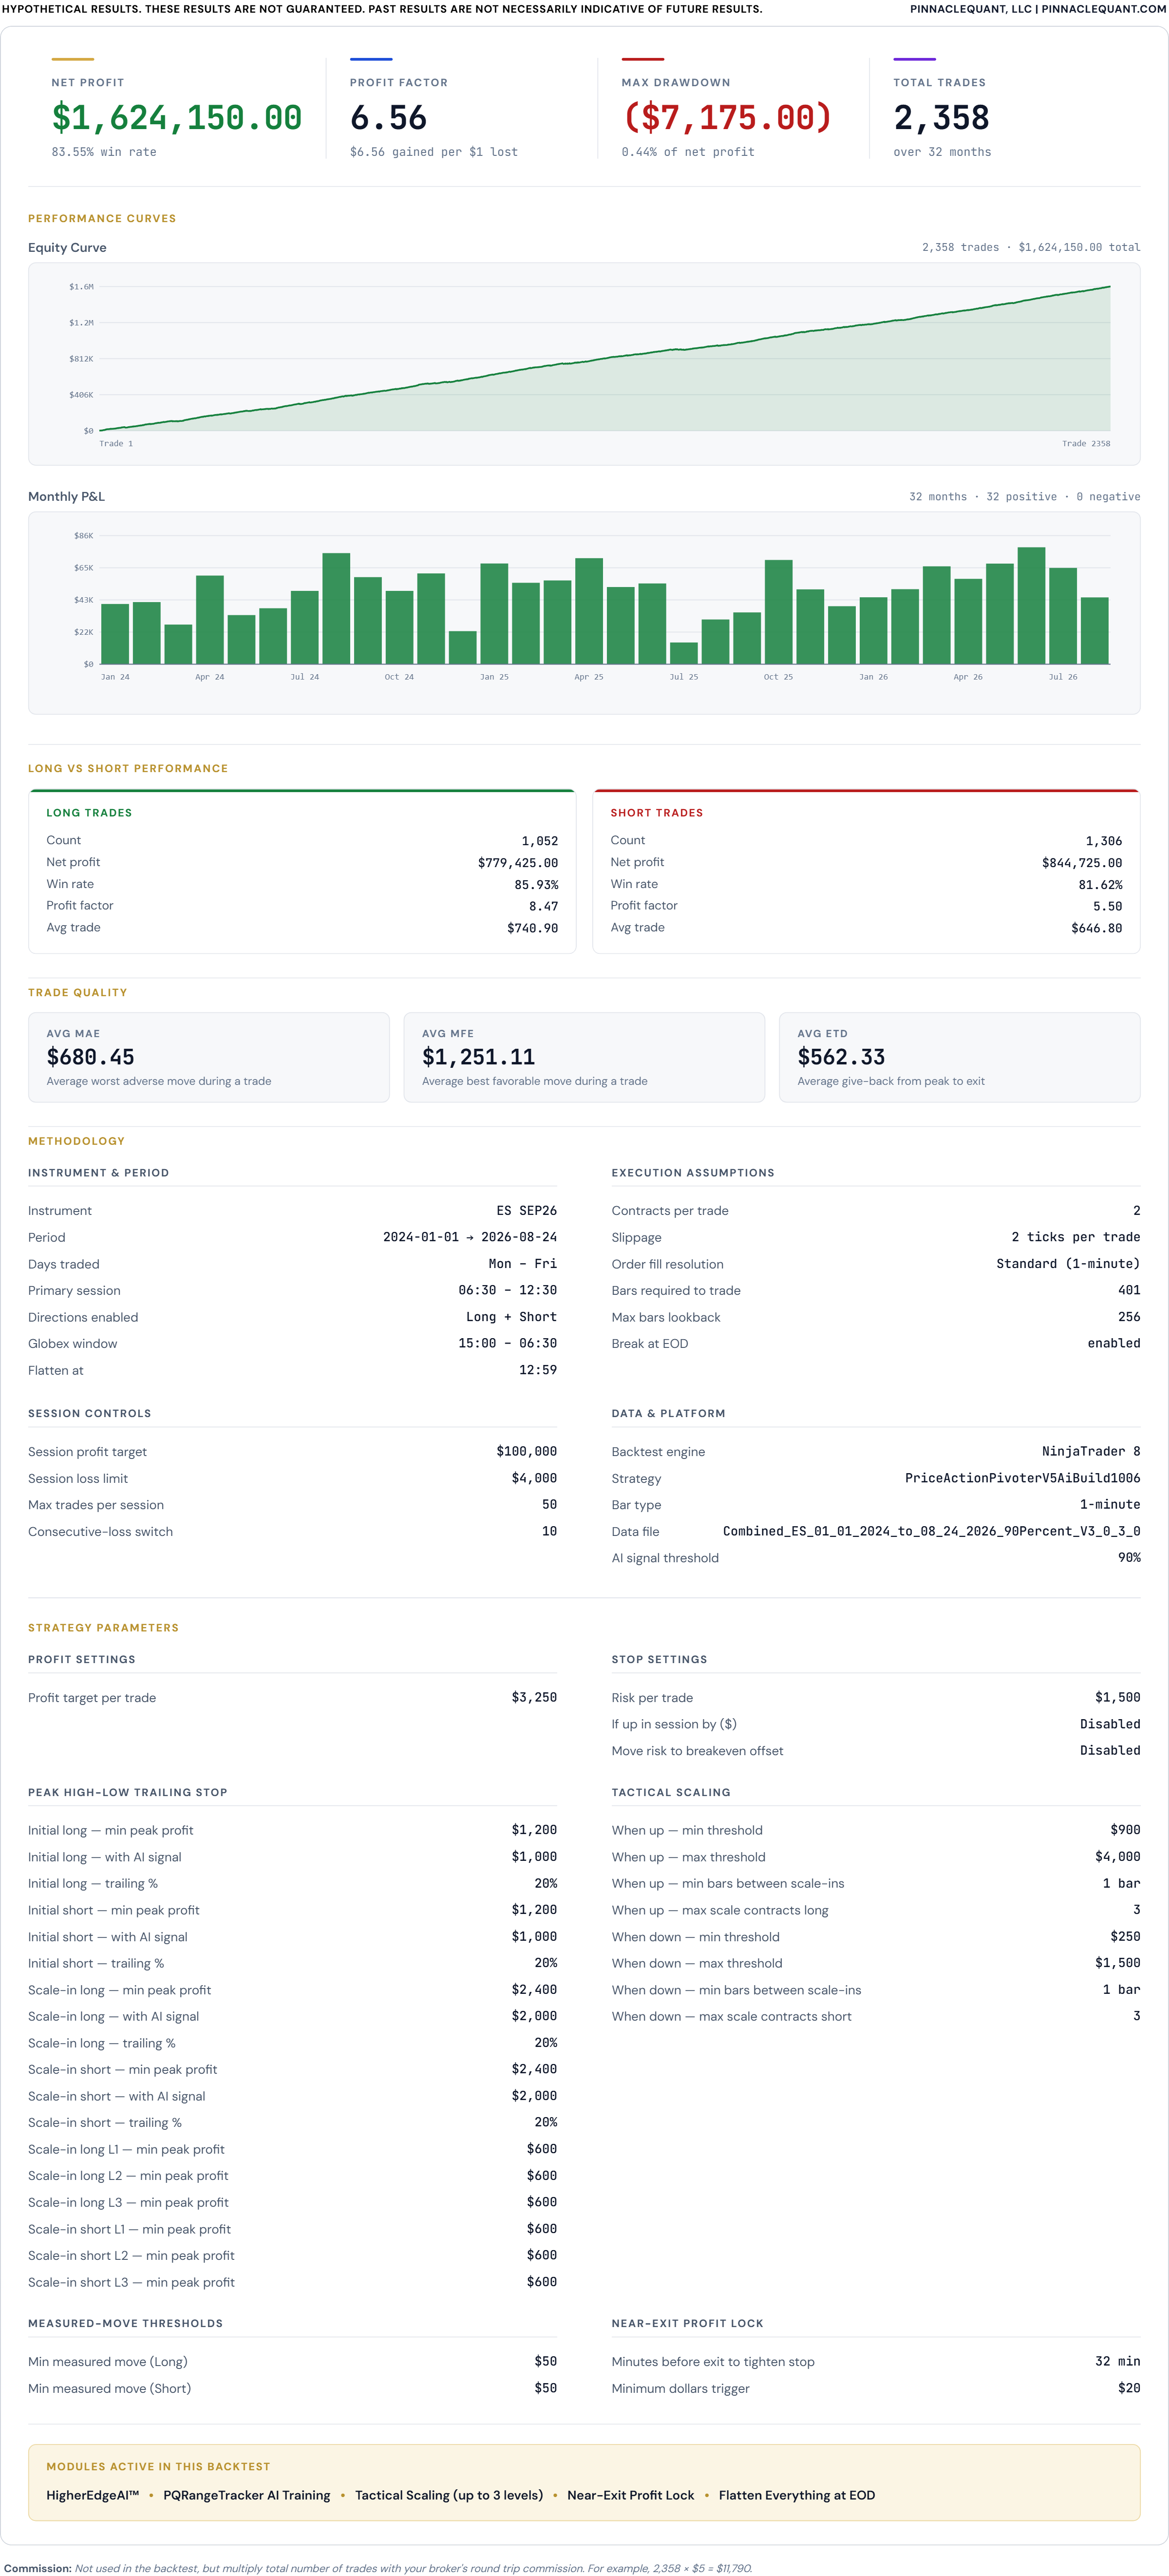
NinjaTrader Strategy Analyzer Summary, Backtest 4, ES 2 Contracts 90%NinjaTrader Strategy Analyzer Monthly, Backtest 4, ES 2 Contracts 90%NinjaTrader Strategy Analyzer Yearly, Backtest 4, ES 2 Contracts 90%

NinjaTrader trade details, Backtest 4
Net profit$1,624,150.00
Gross profit$1,916,400.00
Gross loss($292,250.00)
Profit factor6.56
Max drawdown($7,175.00)
Number of trades2,358
Win rate83.55%
Winning trades1,970
Losing trades344
Start date1/1/2024
End date8/24/2026
Hours traded6:30 AM – 12:30 PM Pacific
Flatten everything12:59 PM Pacific
Sortino ratio1.00
Sharpe ratio2.12
Average time in market64.76 min
Max time to recover18.83 days
Longest flat period10.89 days
Average MAE$680.45
Average MFE$1,251.11
Market conditionAll, incl. economic news events
Contracts2
Slippage2 ticks
CommissionNot included; e.g. $10 × 2,358 = $23,580
Backtest 5 · NinjaTrader Strategy AnalyzerNQ · 1 Contract · 80% HigherEdgeAI™ 3.0 Confidence Threshold
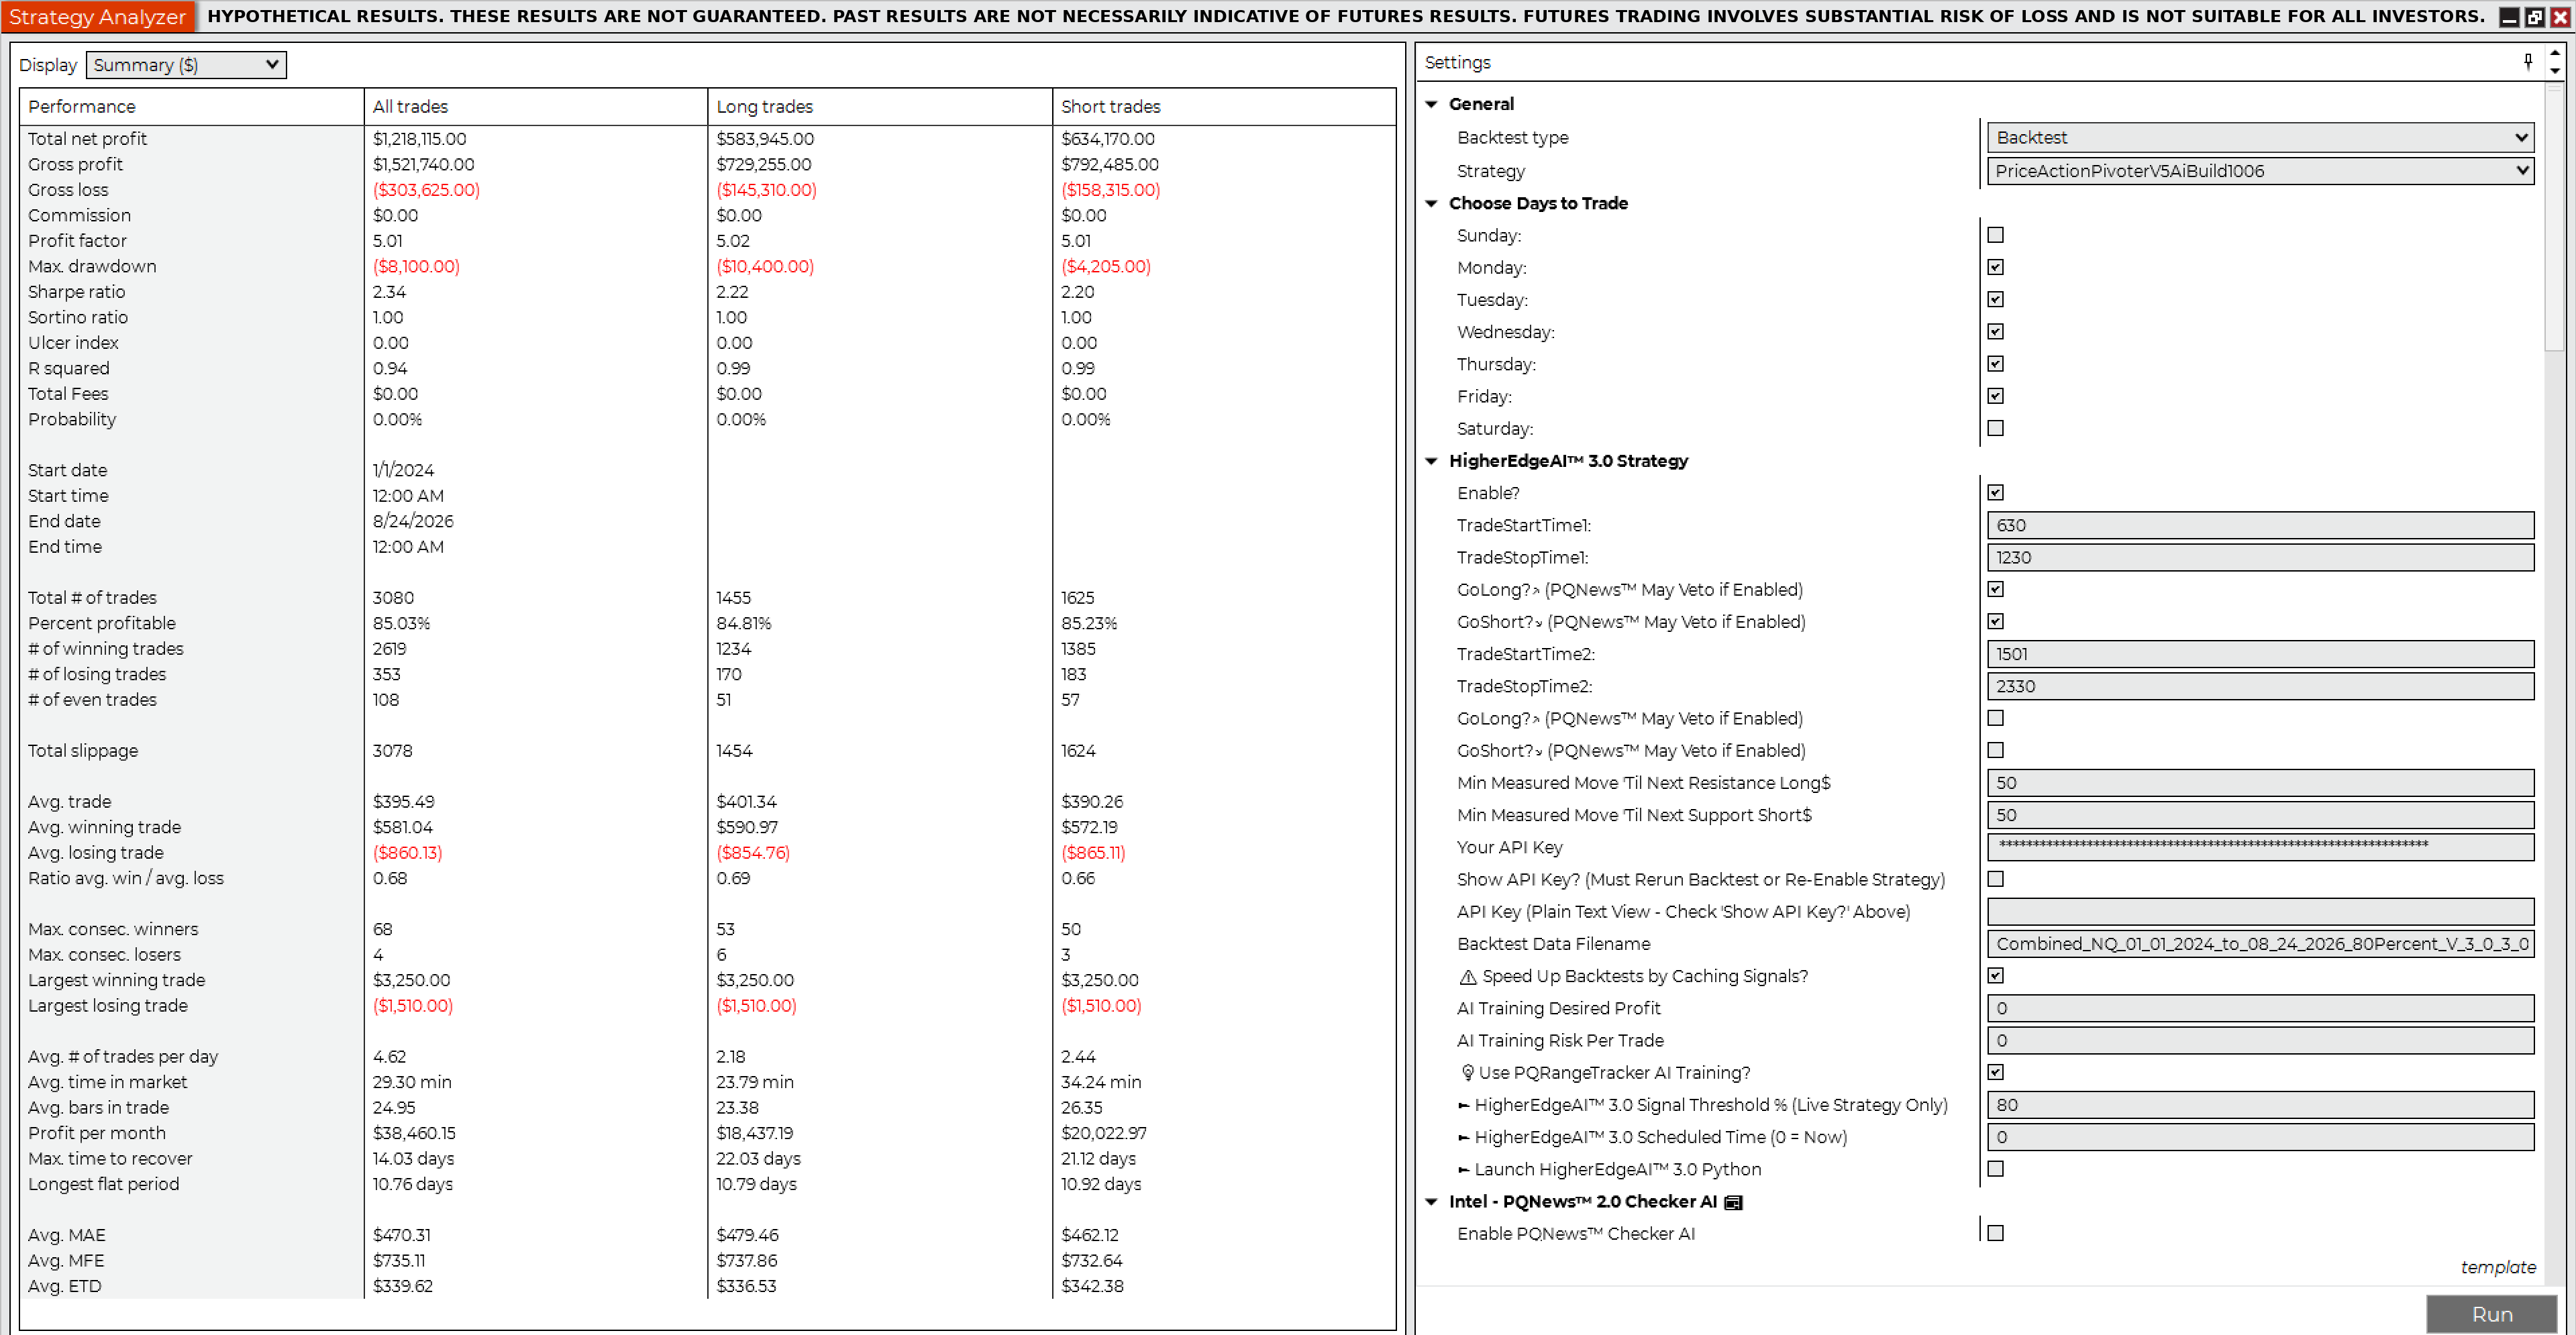
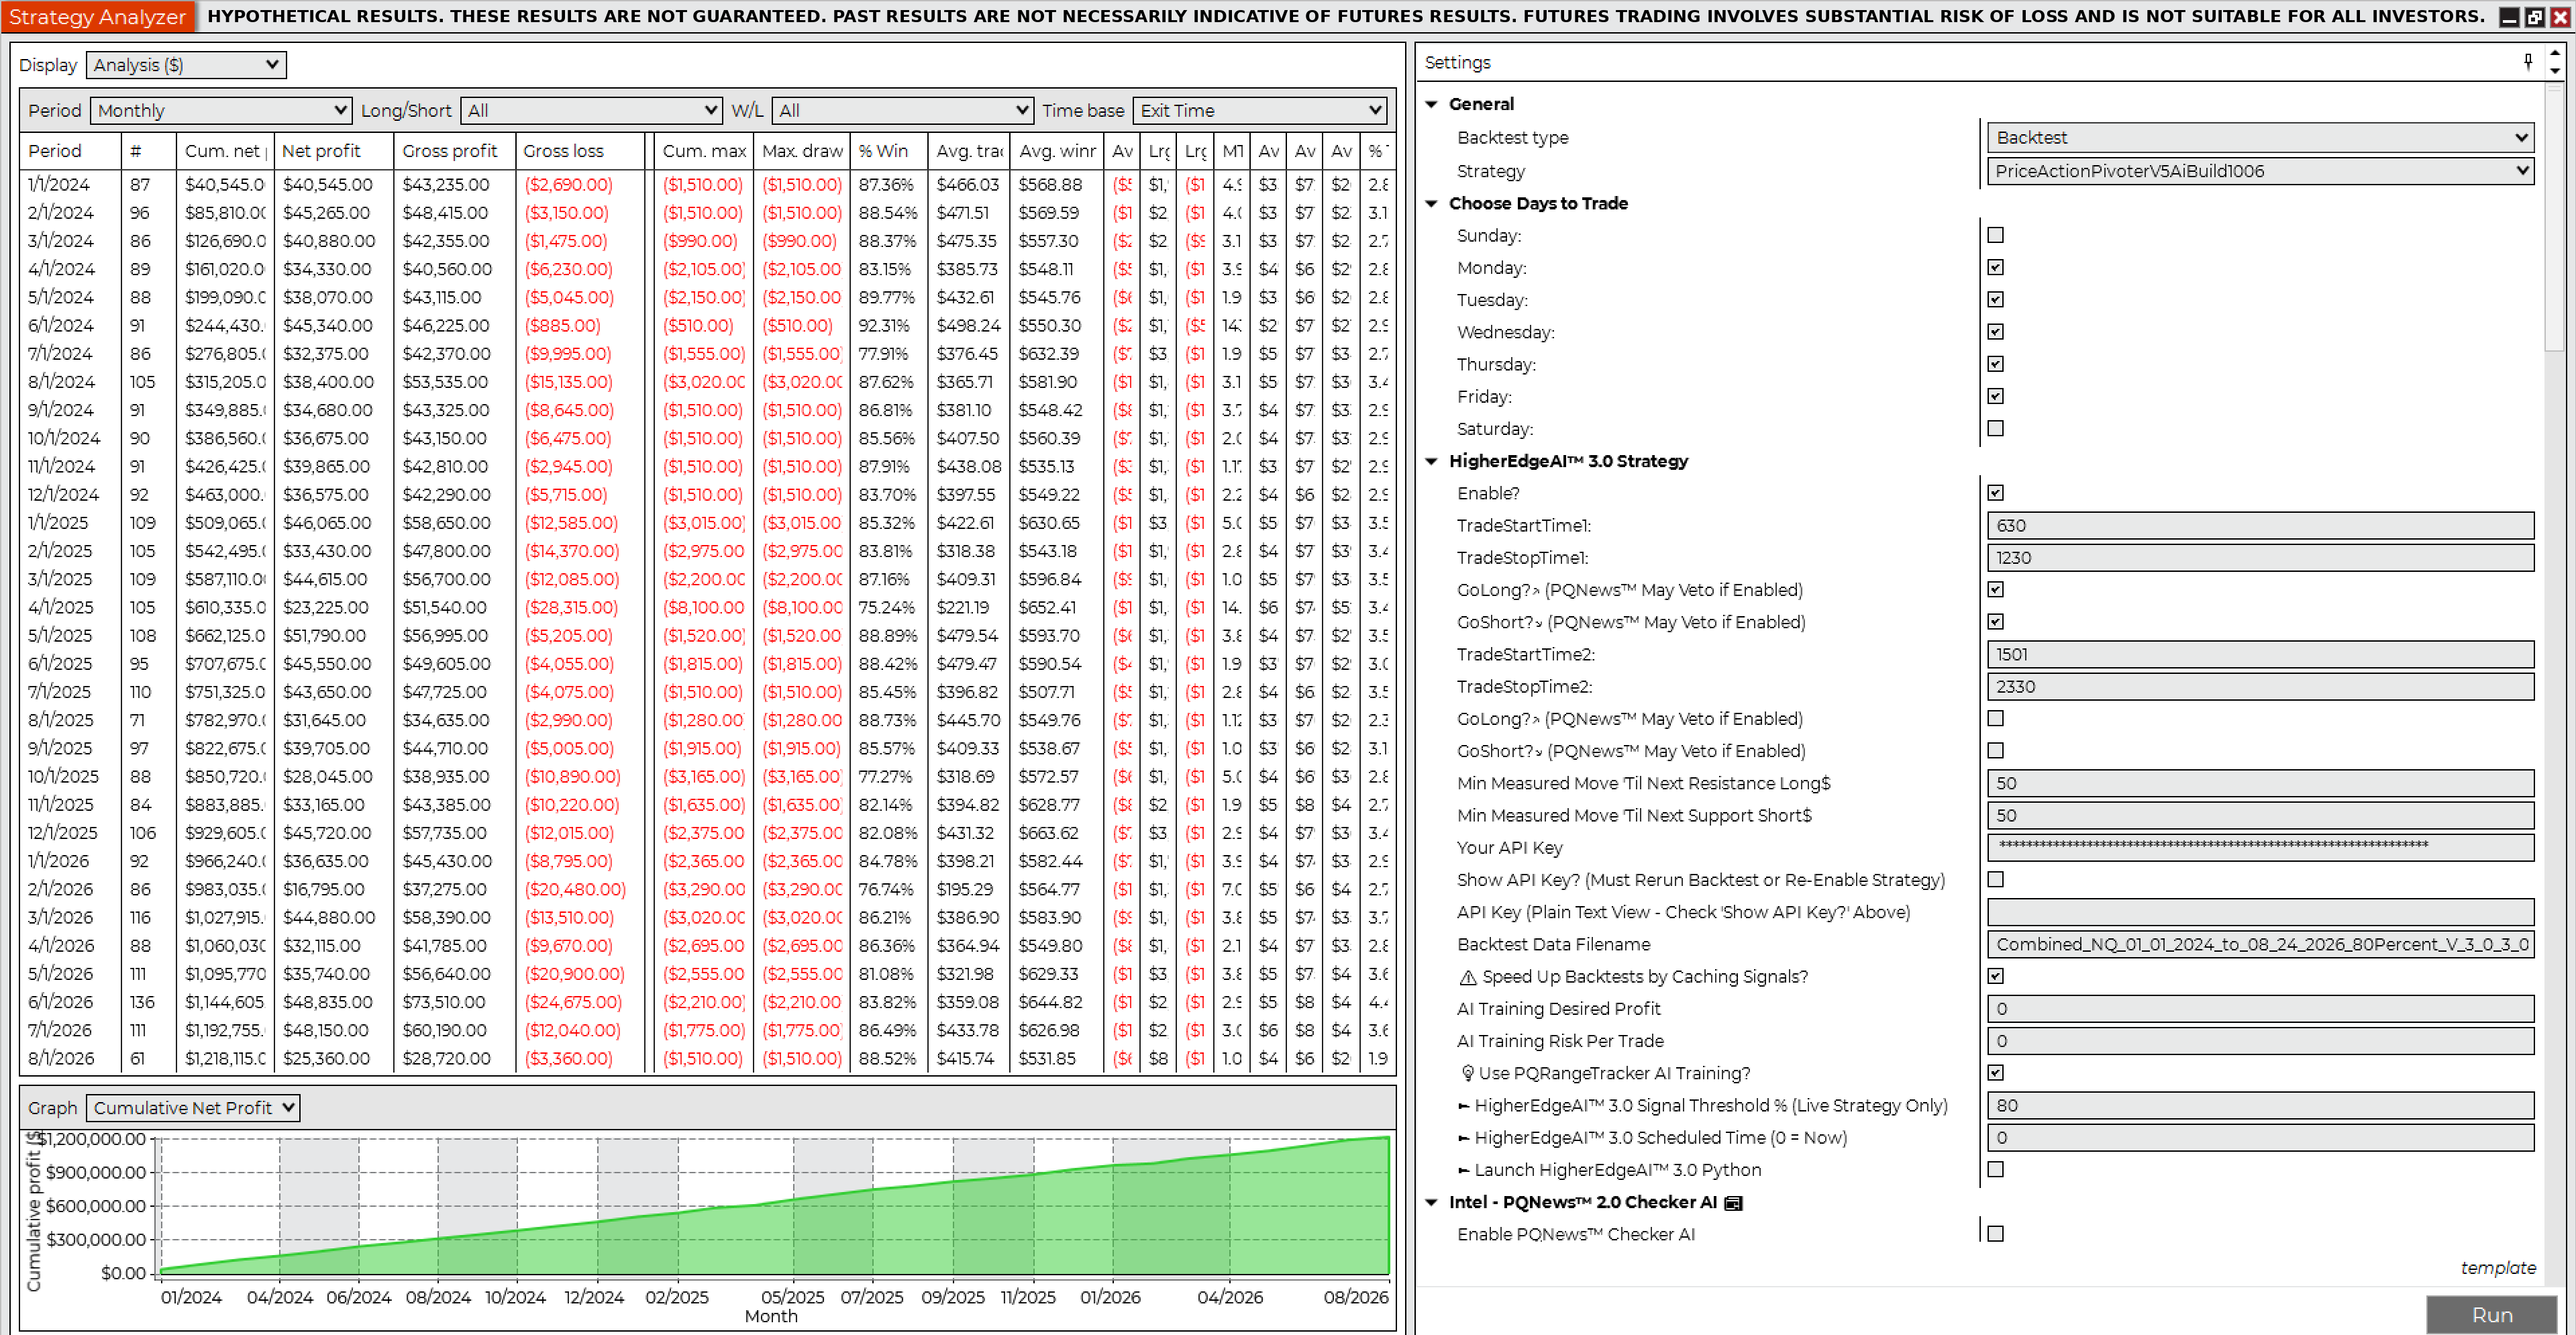
Hypothetical net profit$1,218,115.00

NinjaTrader Strategy Analyzer Summary, Backtest 5, NQ 1 Contract 80%NinjaTrader Strategy Analyzer Monthly, Backtest 5, NQ 1 Contract 80%NinjaTrader Strategy Analyzer Yearly, Backtest 5, NQ 1 Contract 80%

NinjaTrader trade details, Backtest 5
Net profit$1,218,115.00
Gross profit$1,521,740.00
Gross loss($303,625.00)
Profit factor5.01
Max drawdown($8,100.00)
Number of trades3,080
Win rate85.03%
Winning trades2,619
Losing trades353
Start date1/1/2024
End date8/24/2026
Hours traded6:30 AM – 12:30 PM Pacific
Flatten everything12:59 PM Pacific
Sortino ratio1.00
Sharpe ratio2.34
Average time in market29.30 min
Max time to recover14.03 days
Longest flat period10.76 days
Average MAE$470.31
Average MFE$735.11
Market conditionAll, incl. economic news events
Contracts1
Slippage2 ticks
CommissionNot included; e.g. $5 × 3,080 = $15,400
Backtest 6 · NinjaTrader Strategy AnalyzerNQ · 2 Contracts · 80% HigherEdgeAI™ 3.0 Confidence Threshold
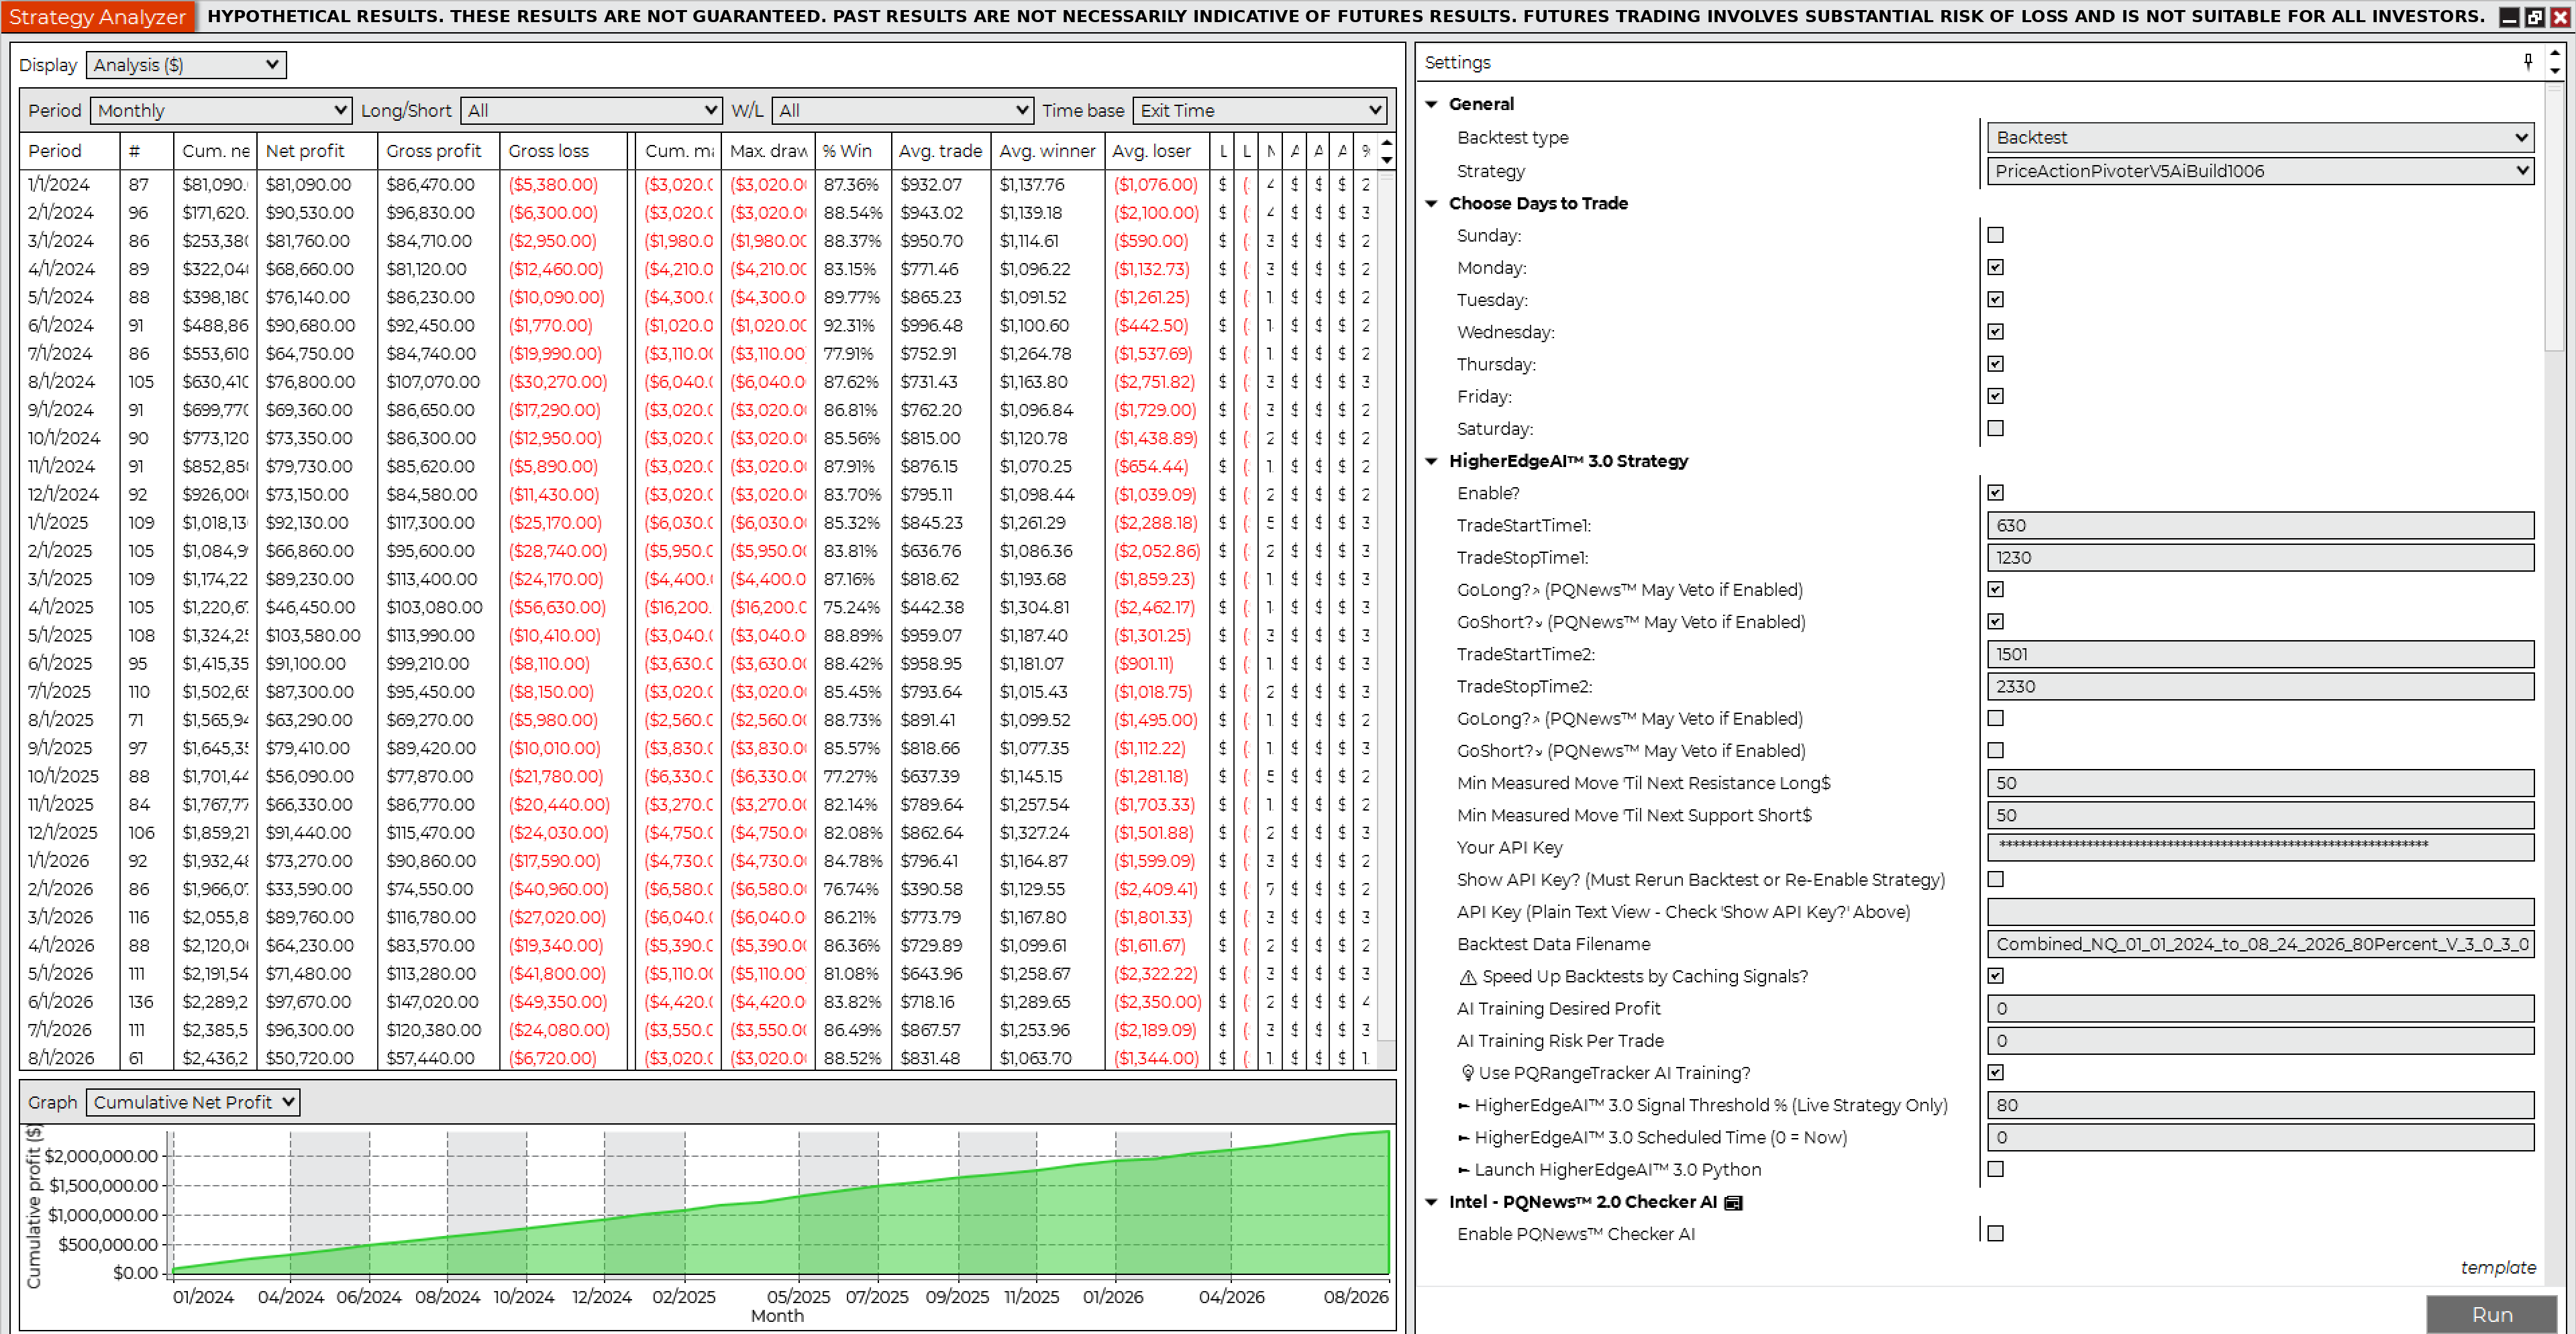
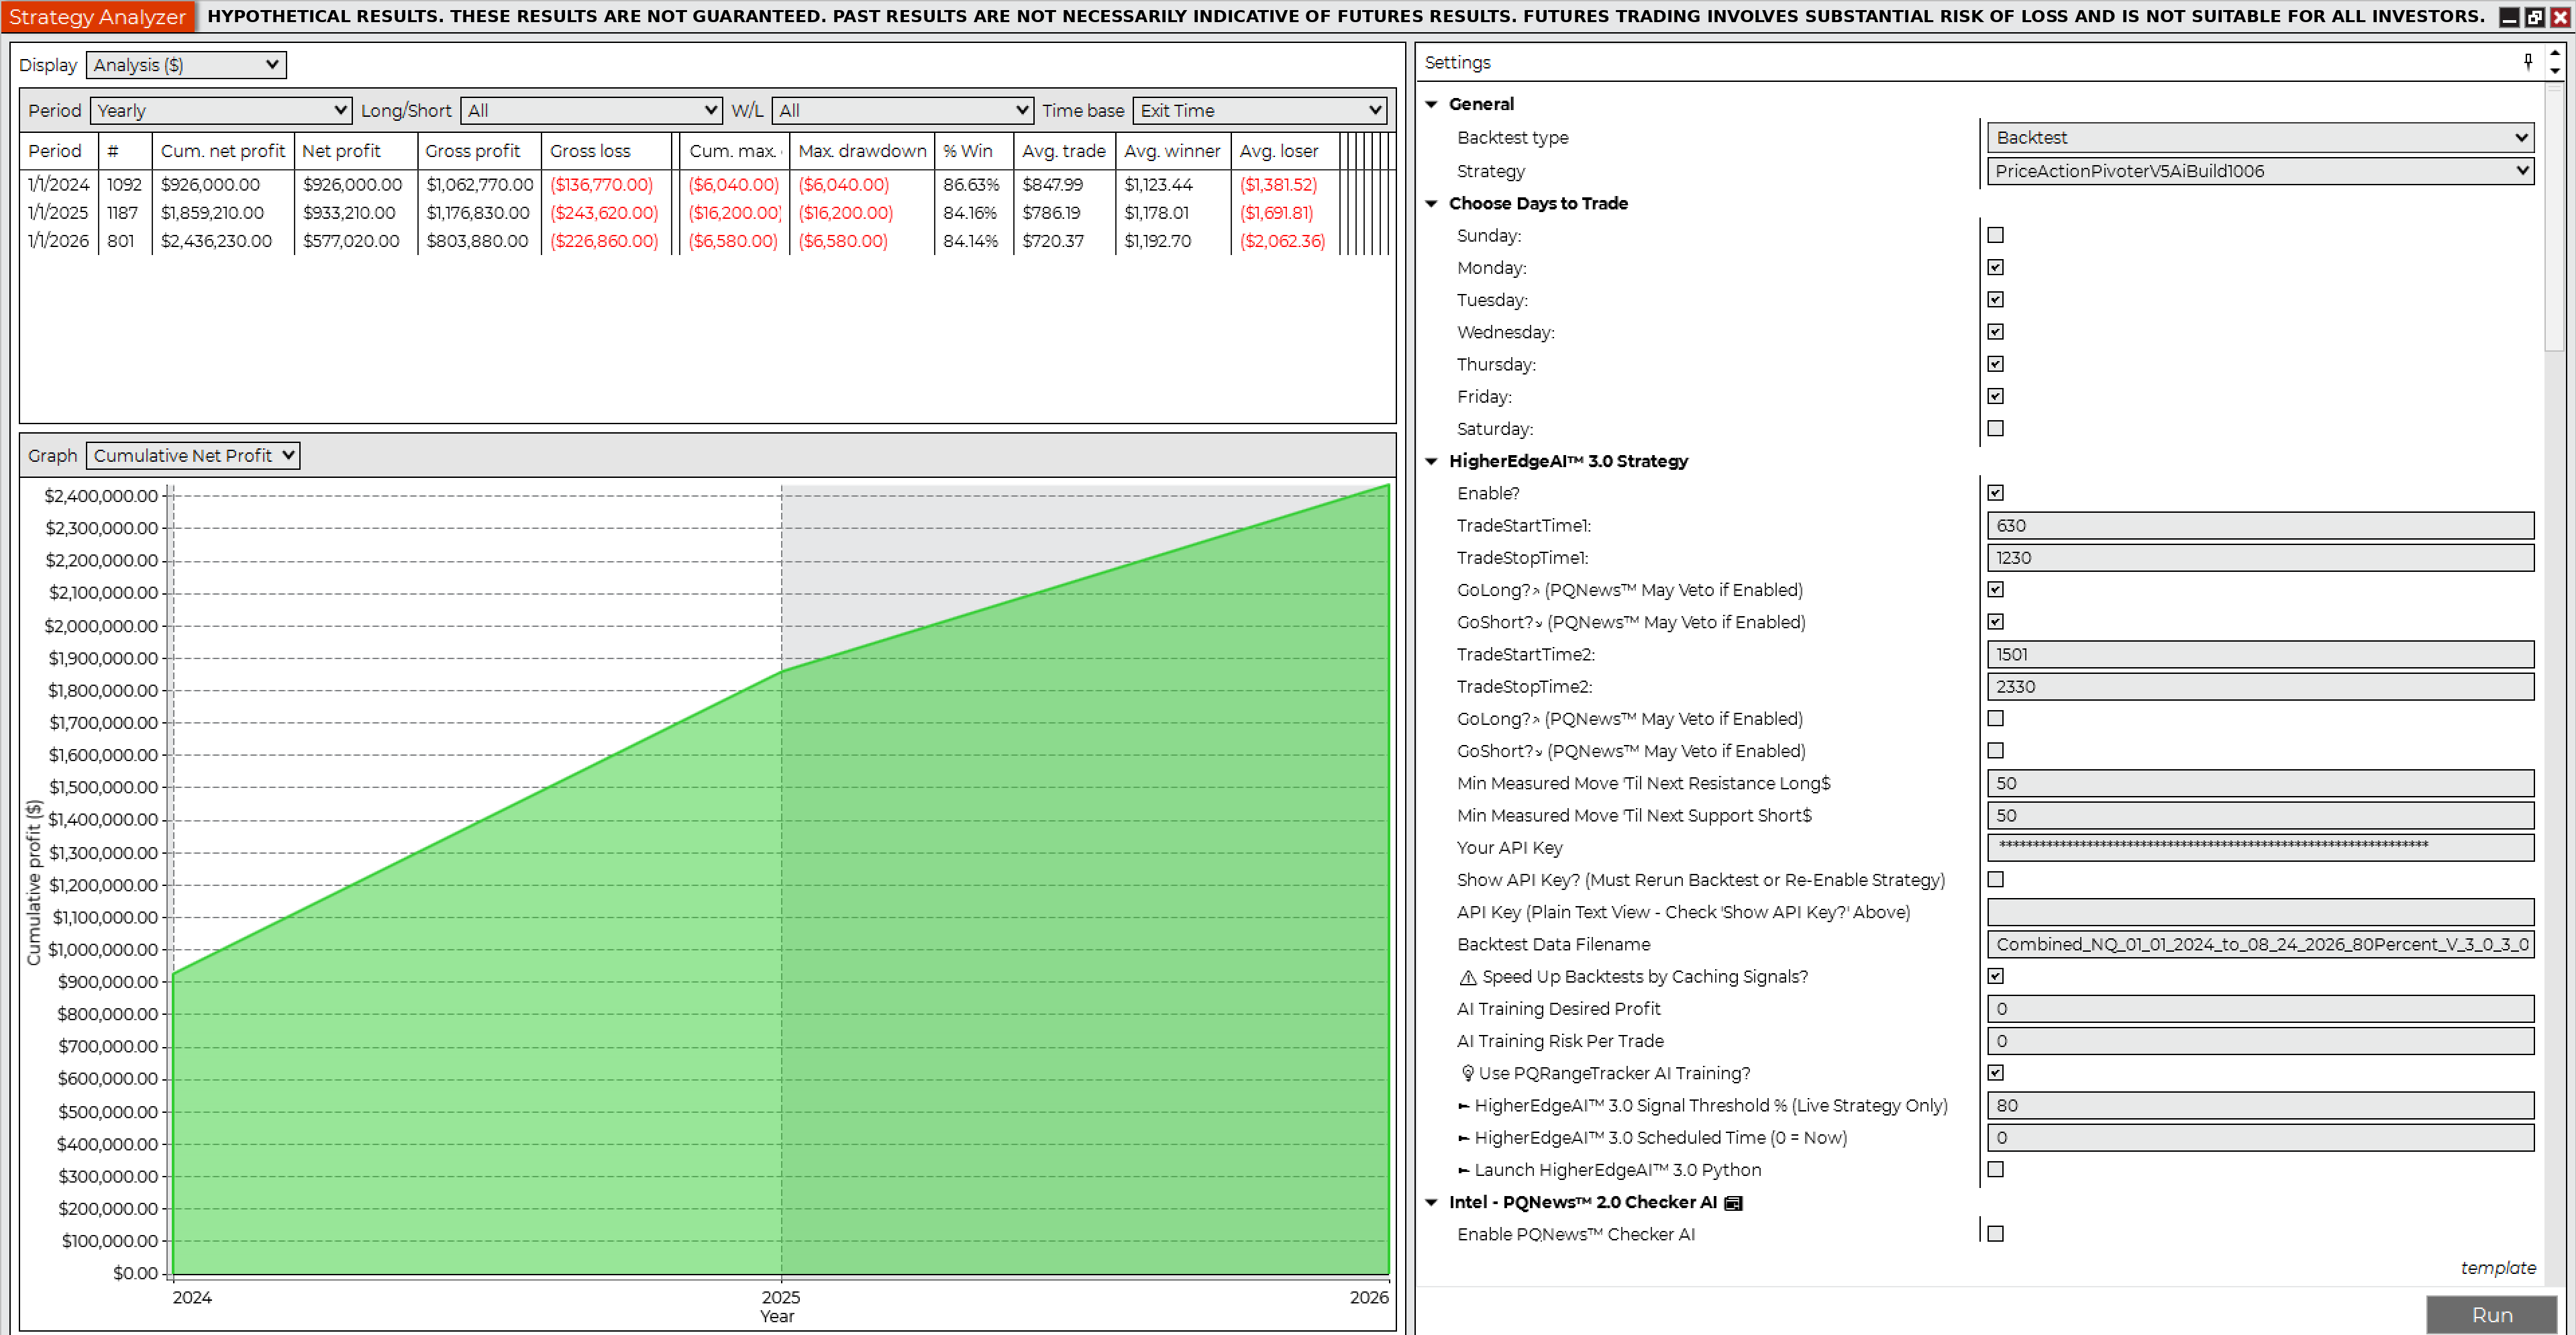
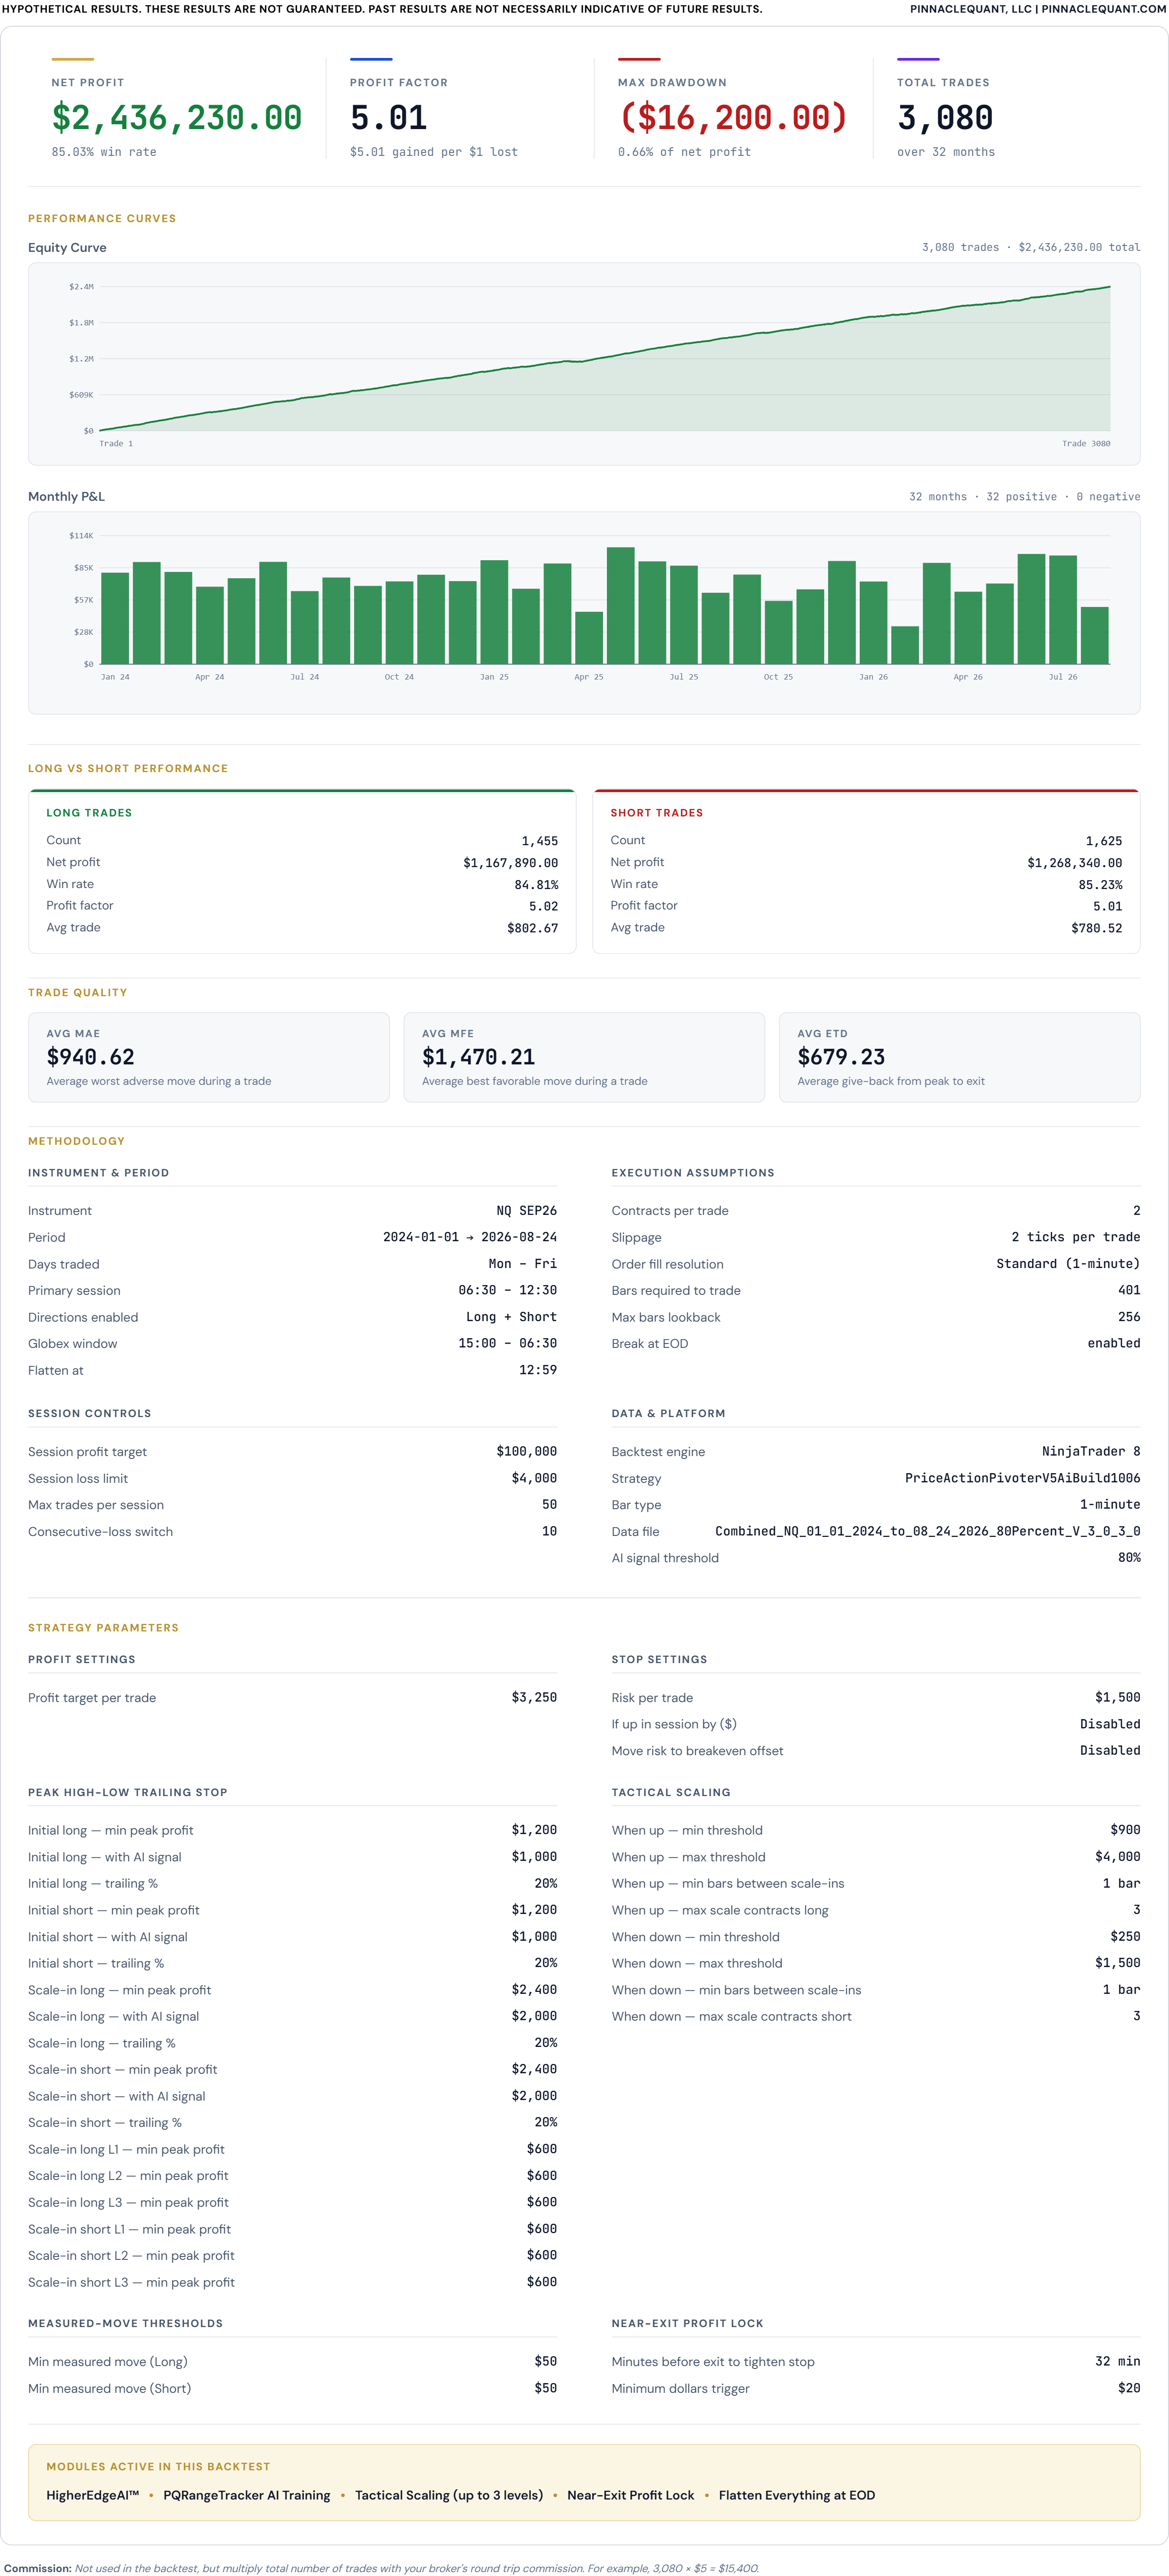
Hypothetical net profit$2,436,230.00

NinjaTrader Strategy Analyzer Summary, Backtest 6, NQ 2 Contracts 80%NinjaTrader Strategy Analyzer Monthly, Backtest 6, NQ 2 Contracts 80%NinjaTrader Strategy Analyzer Yearly, Backtest 6, NQ 2 Contracts 80%

NinjaTrader trade details, Backtest 6
Net profit$2,436,230.00
Gross profit$3,043,480.00
Gross loss($607,250.00)
Profit factor5.01
Max drawdown($16,200.00)
Number of trades3,080
Win rate85.03%
Winning trades2,619
Losing trades353
Start date1/1/2024
End date8/24/2026
Hours traded6:30 AM – 12:30 PM Pacific
Flatten everything12:59 PM Pacific
Sortino ratio1.00
Sharpe ratio2.34
Average time in market29.30 min
Max time to recover14.03 days
Longest flat period10.76 days
Average MAE$940.62
Average MFE$1,470.21
Market conditionAll, incl. economic news events
Contracts2
Slippage2 ticks
CommissionNot included; e.g. $10 × 3,080 = $30,800
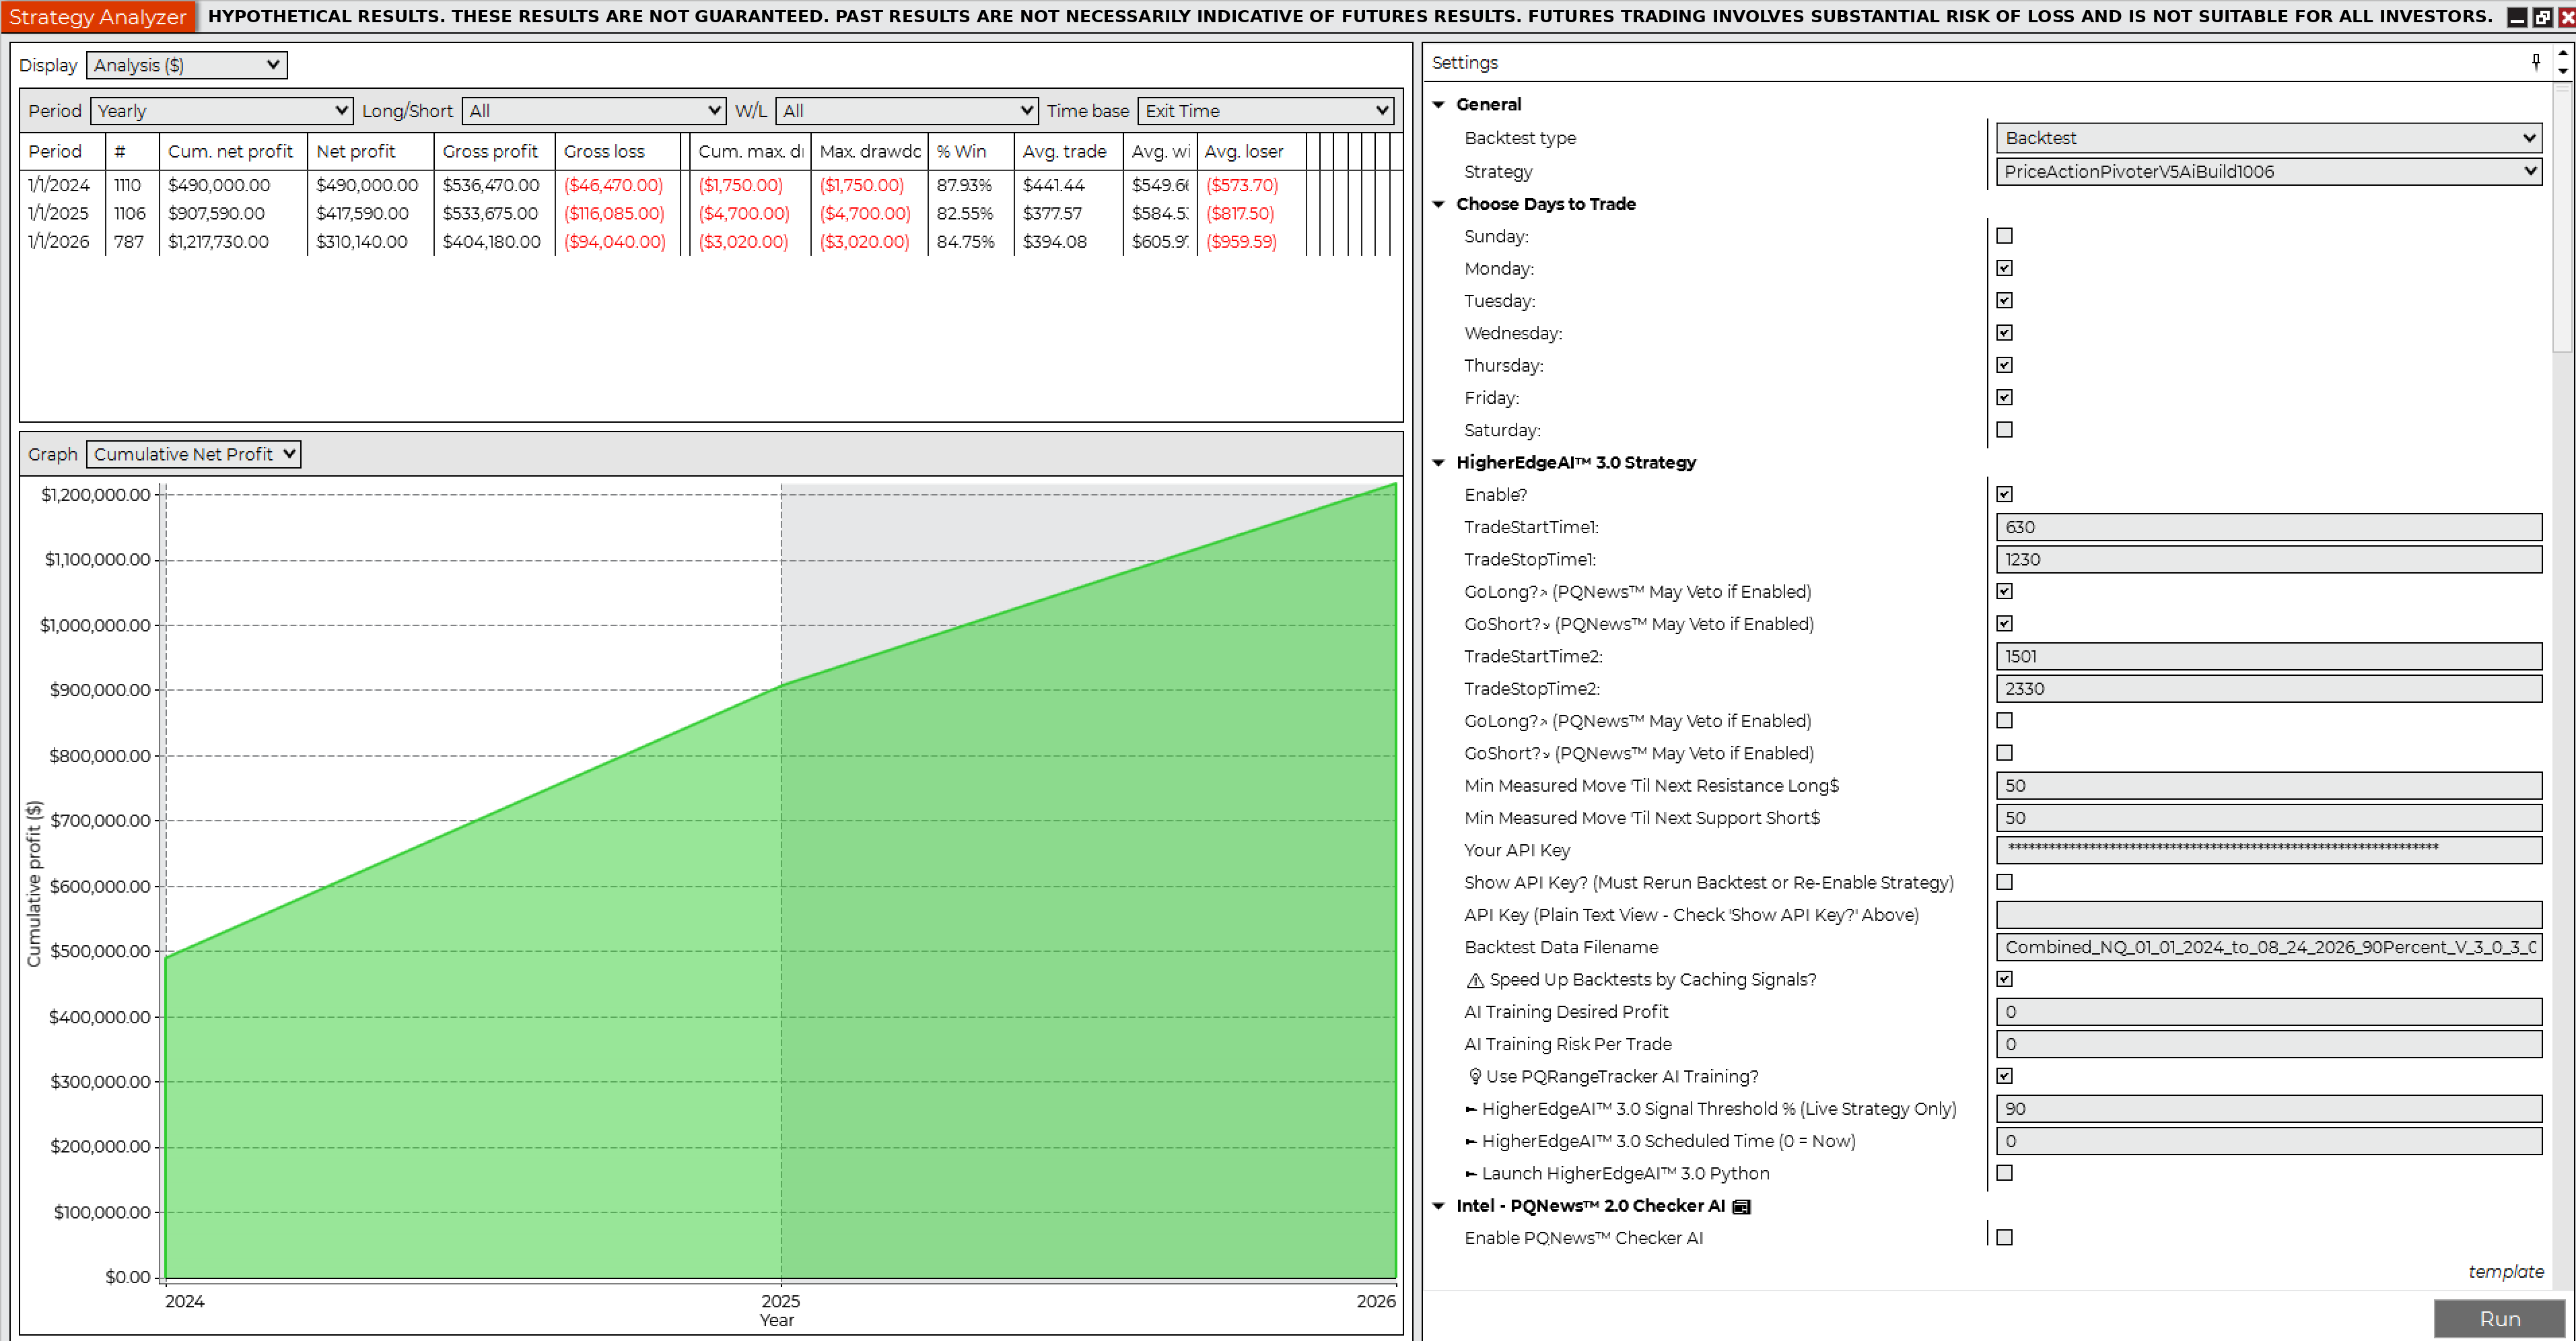
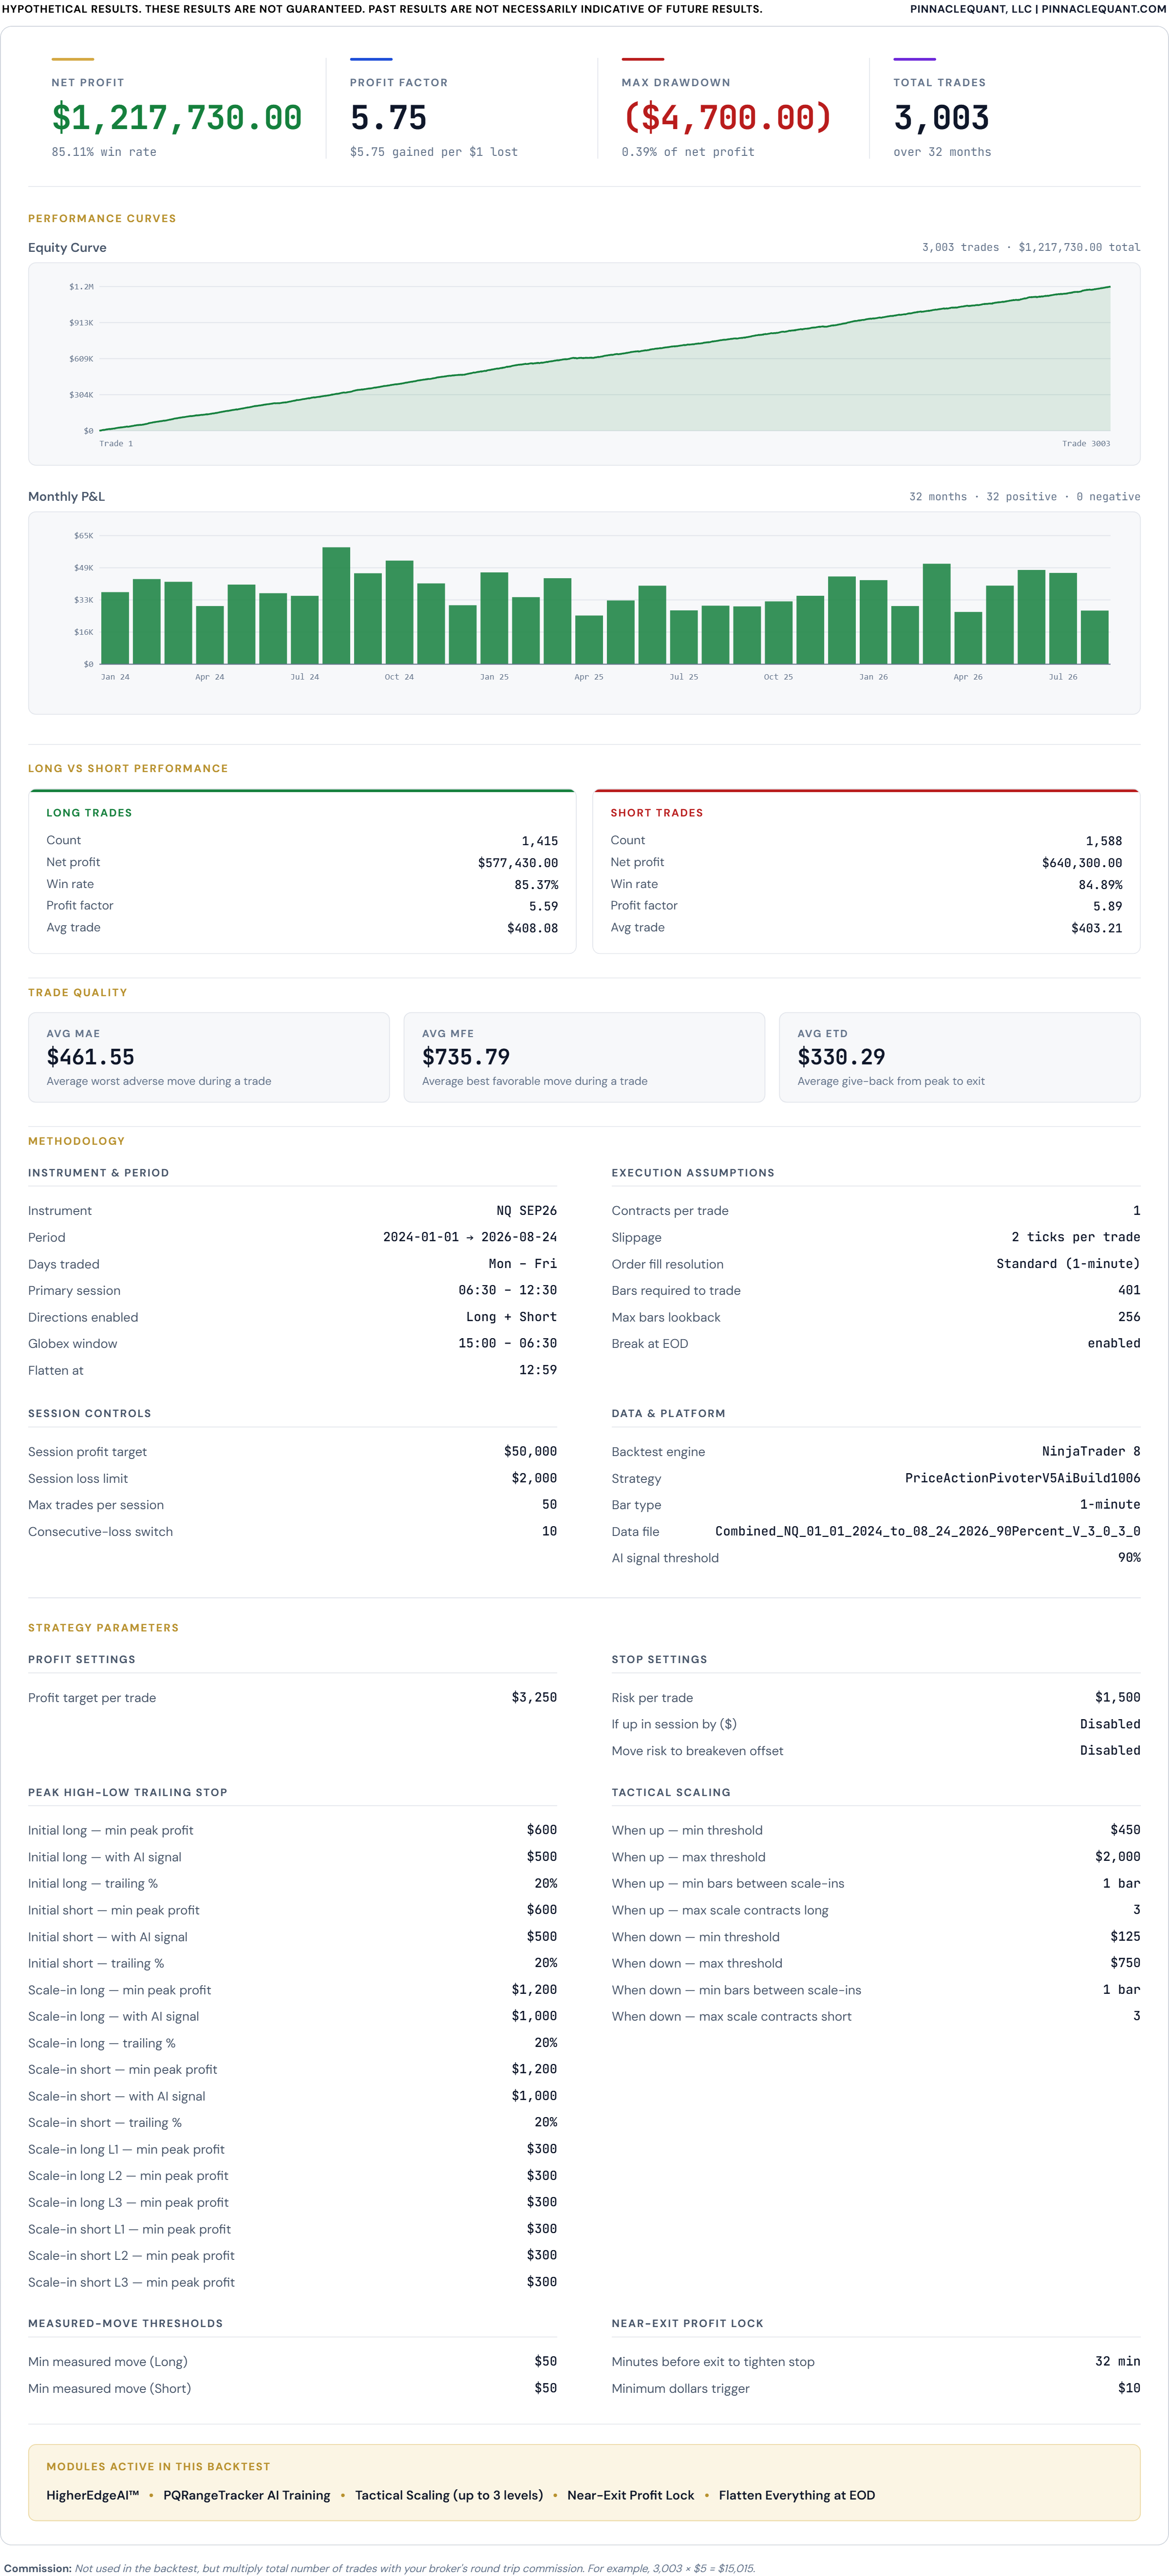
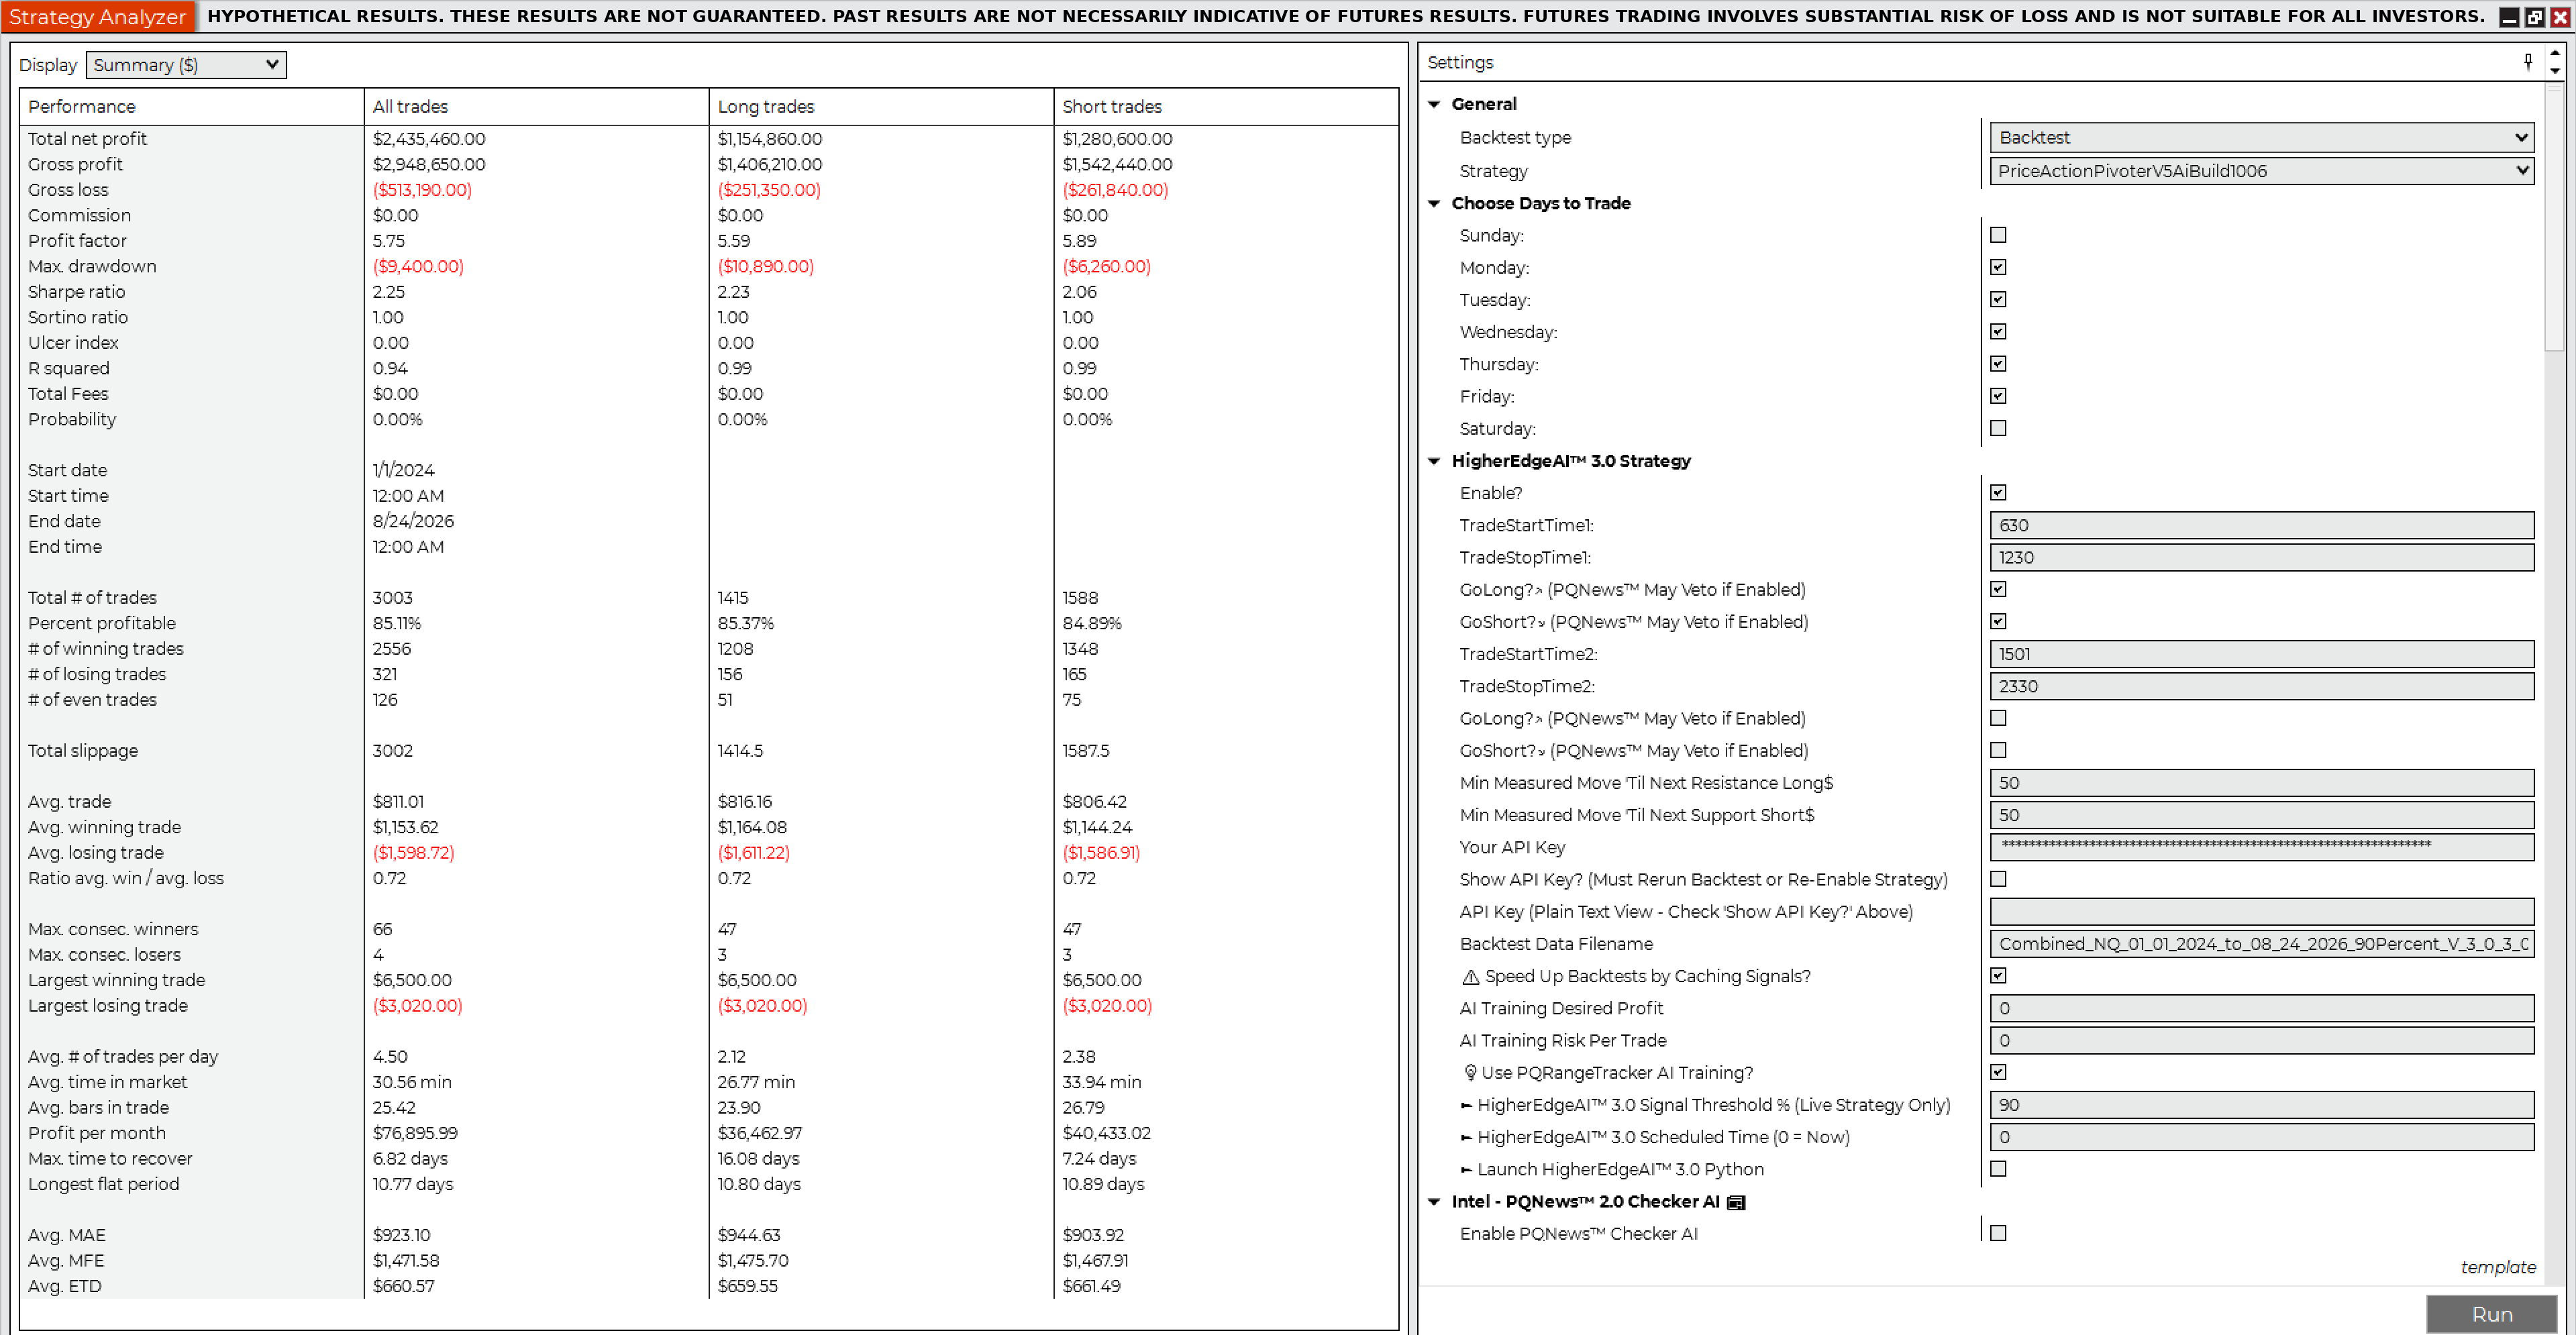
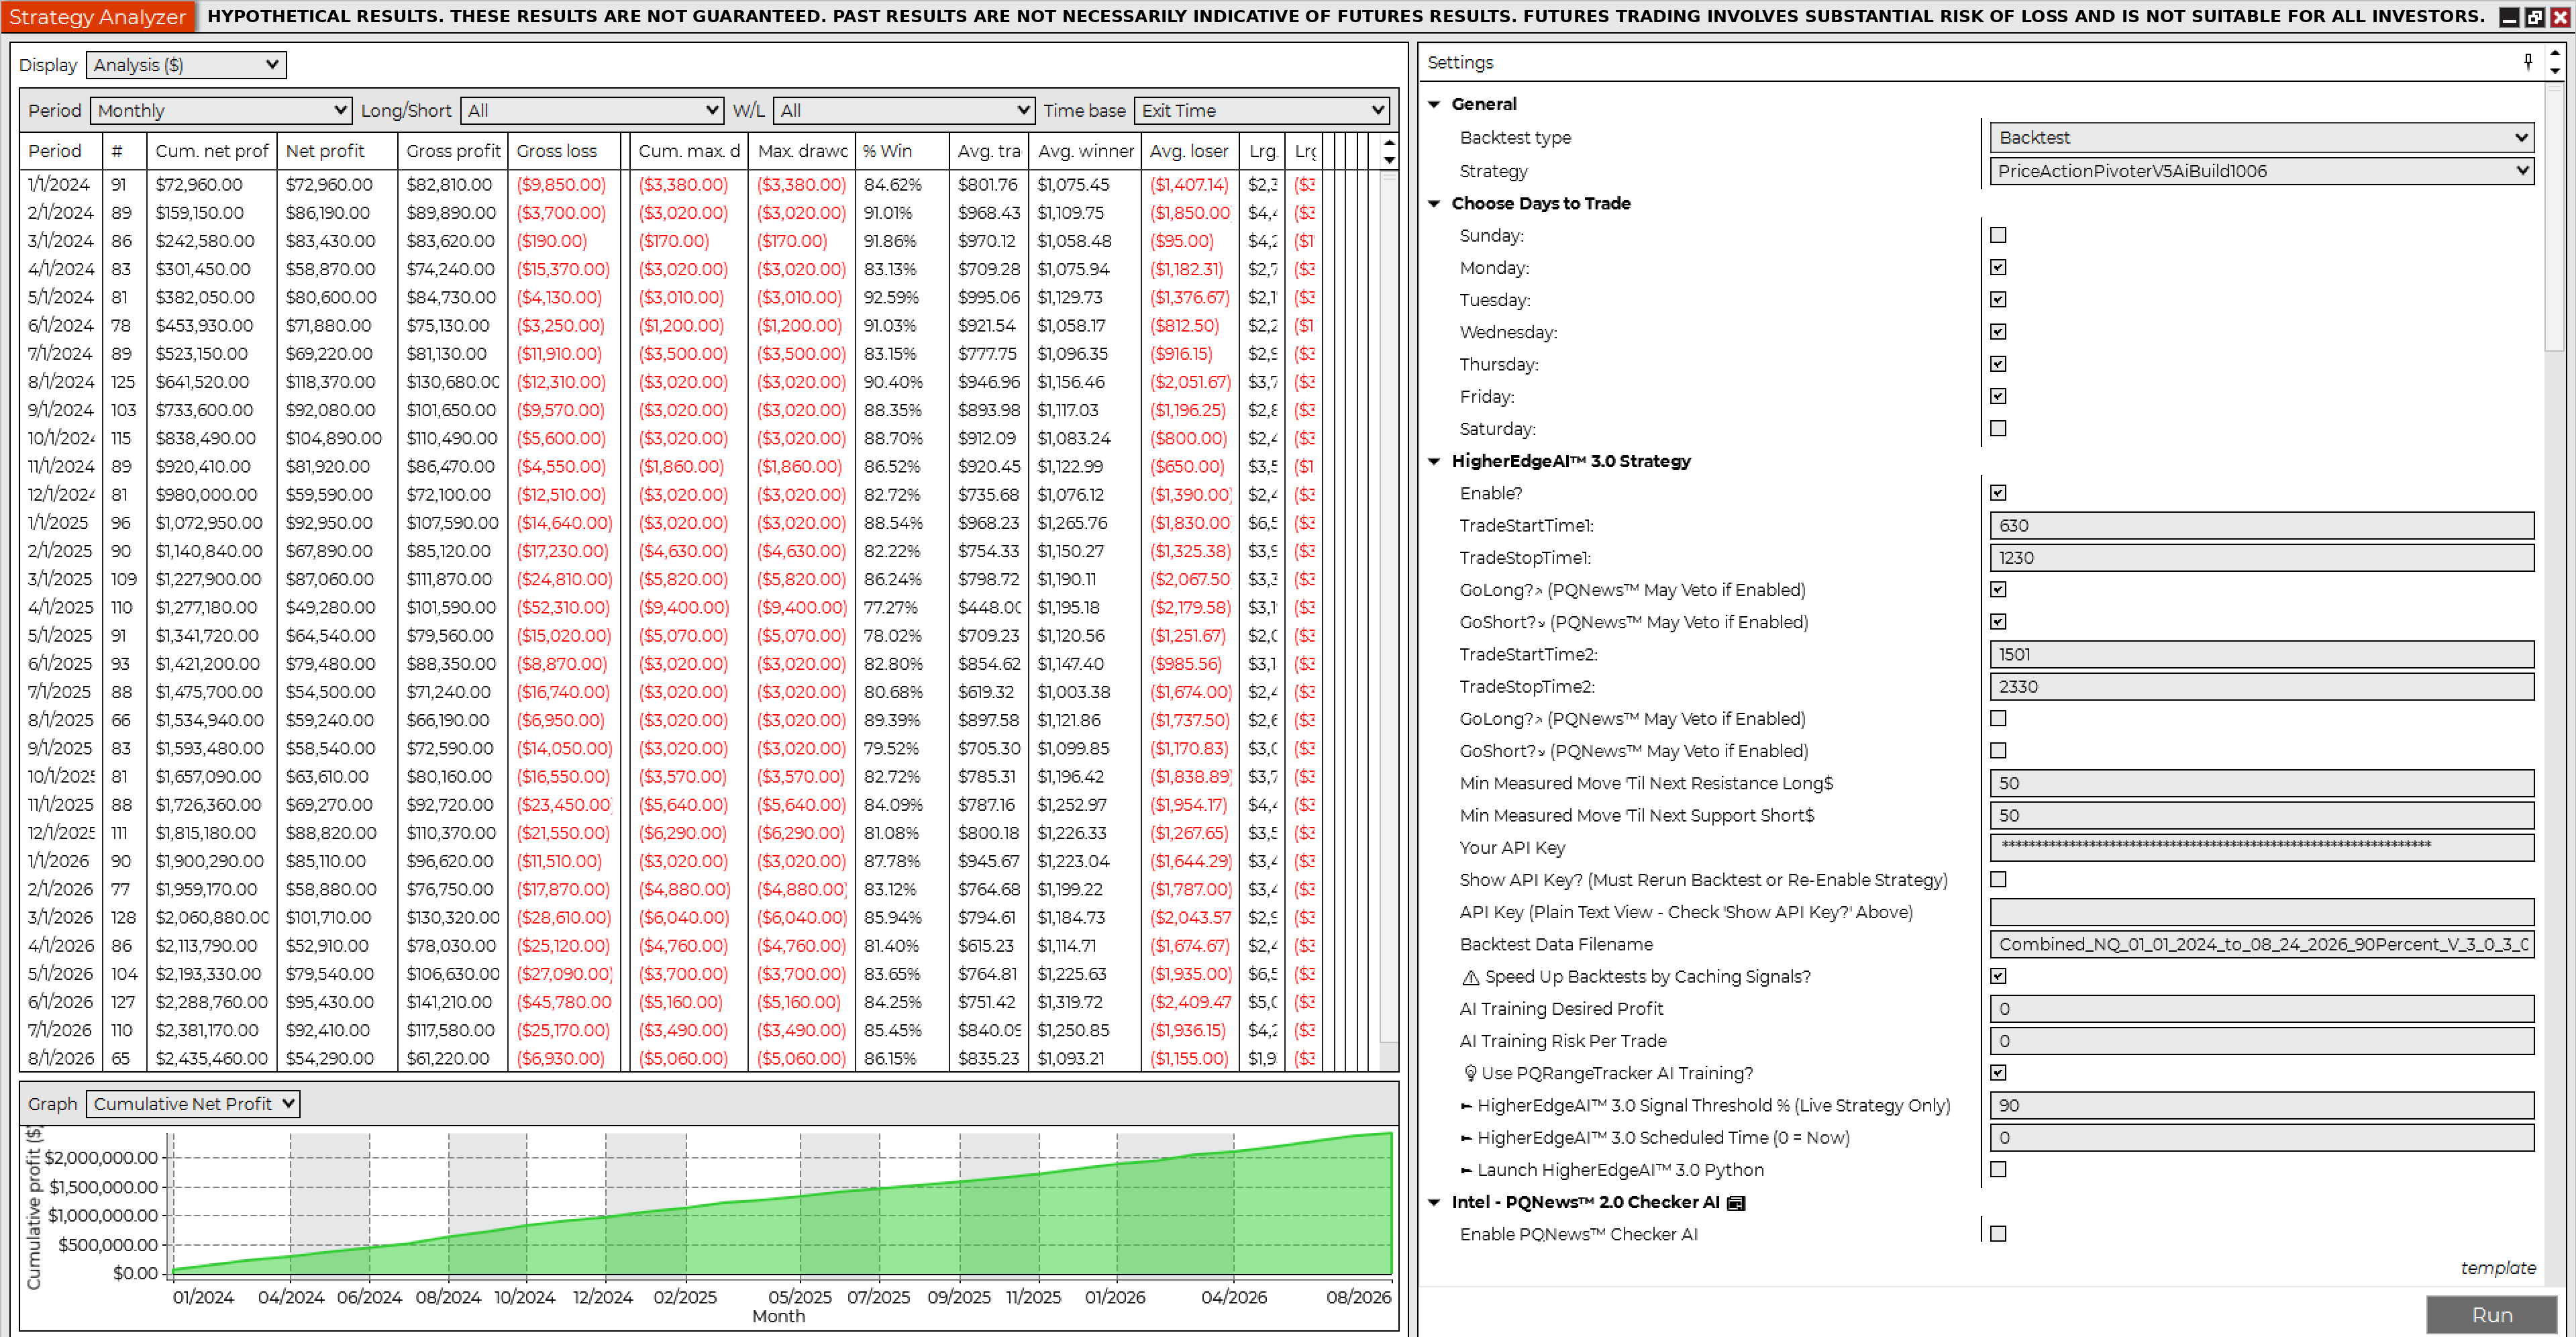
Backtest 7 · NinjaTrader Strategy AnalyzerNQ · 1 Contract · 90% HigherEdgeAI™ 3.0 Confidence Threshold
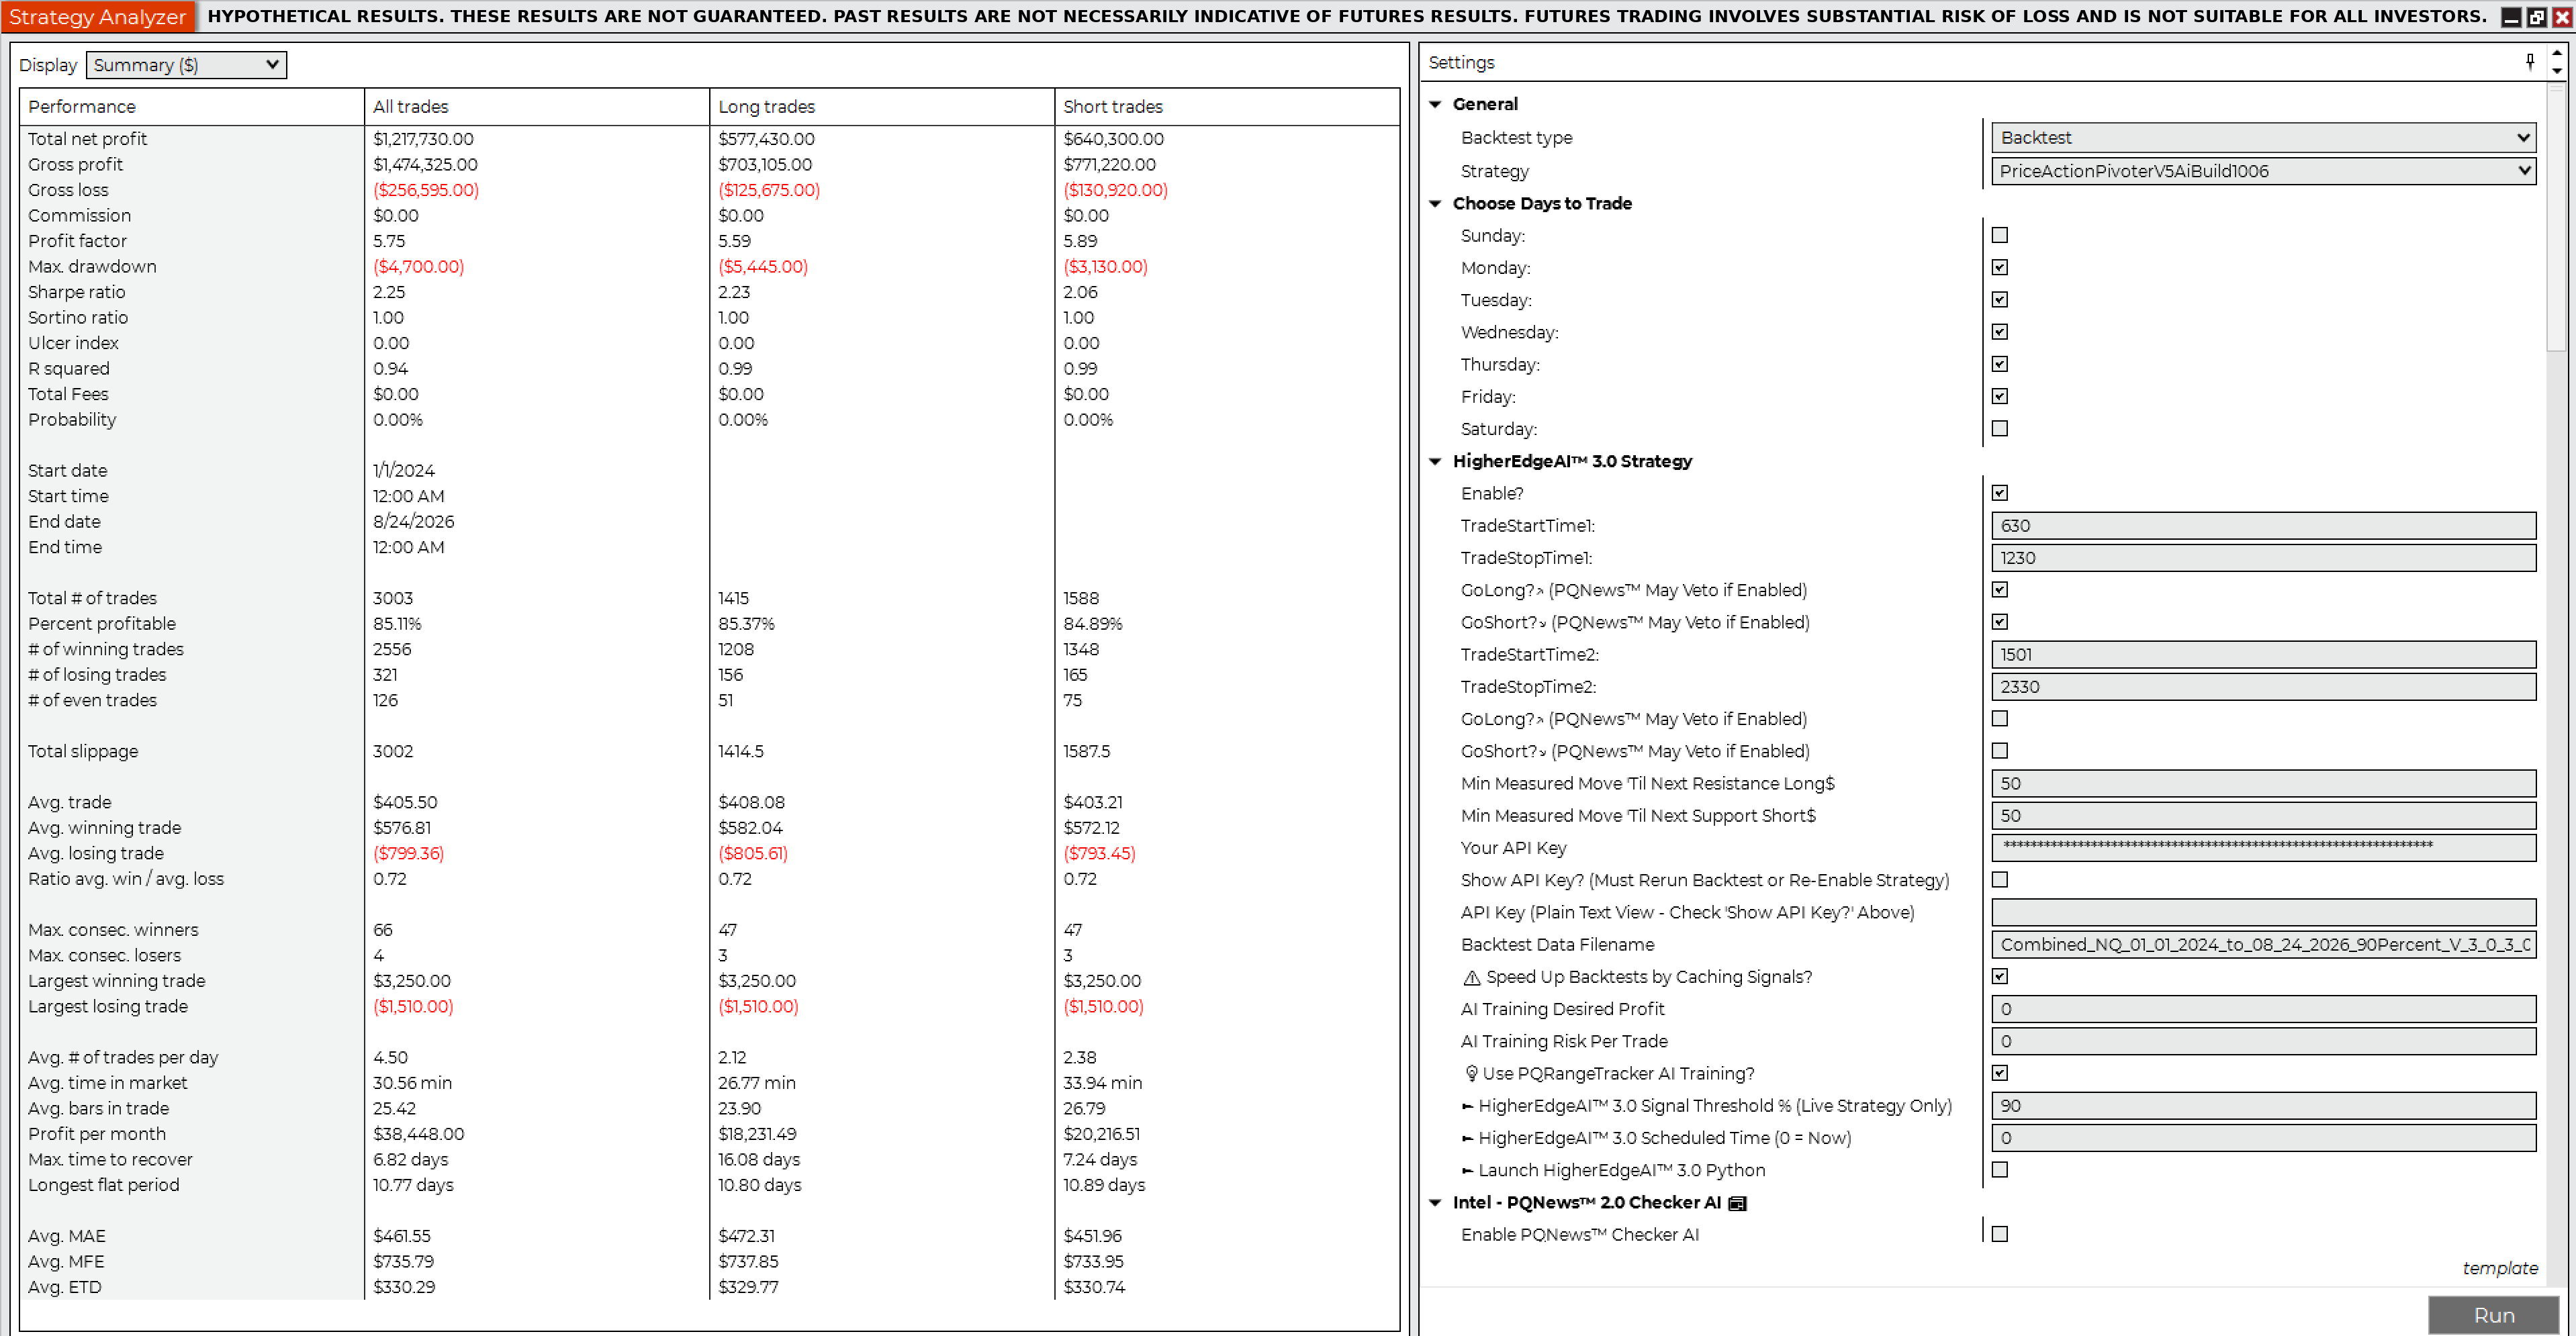
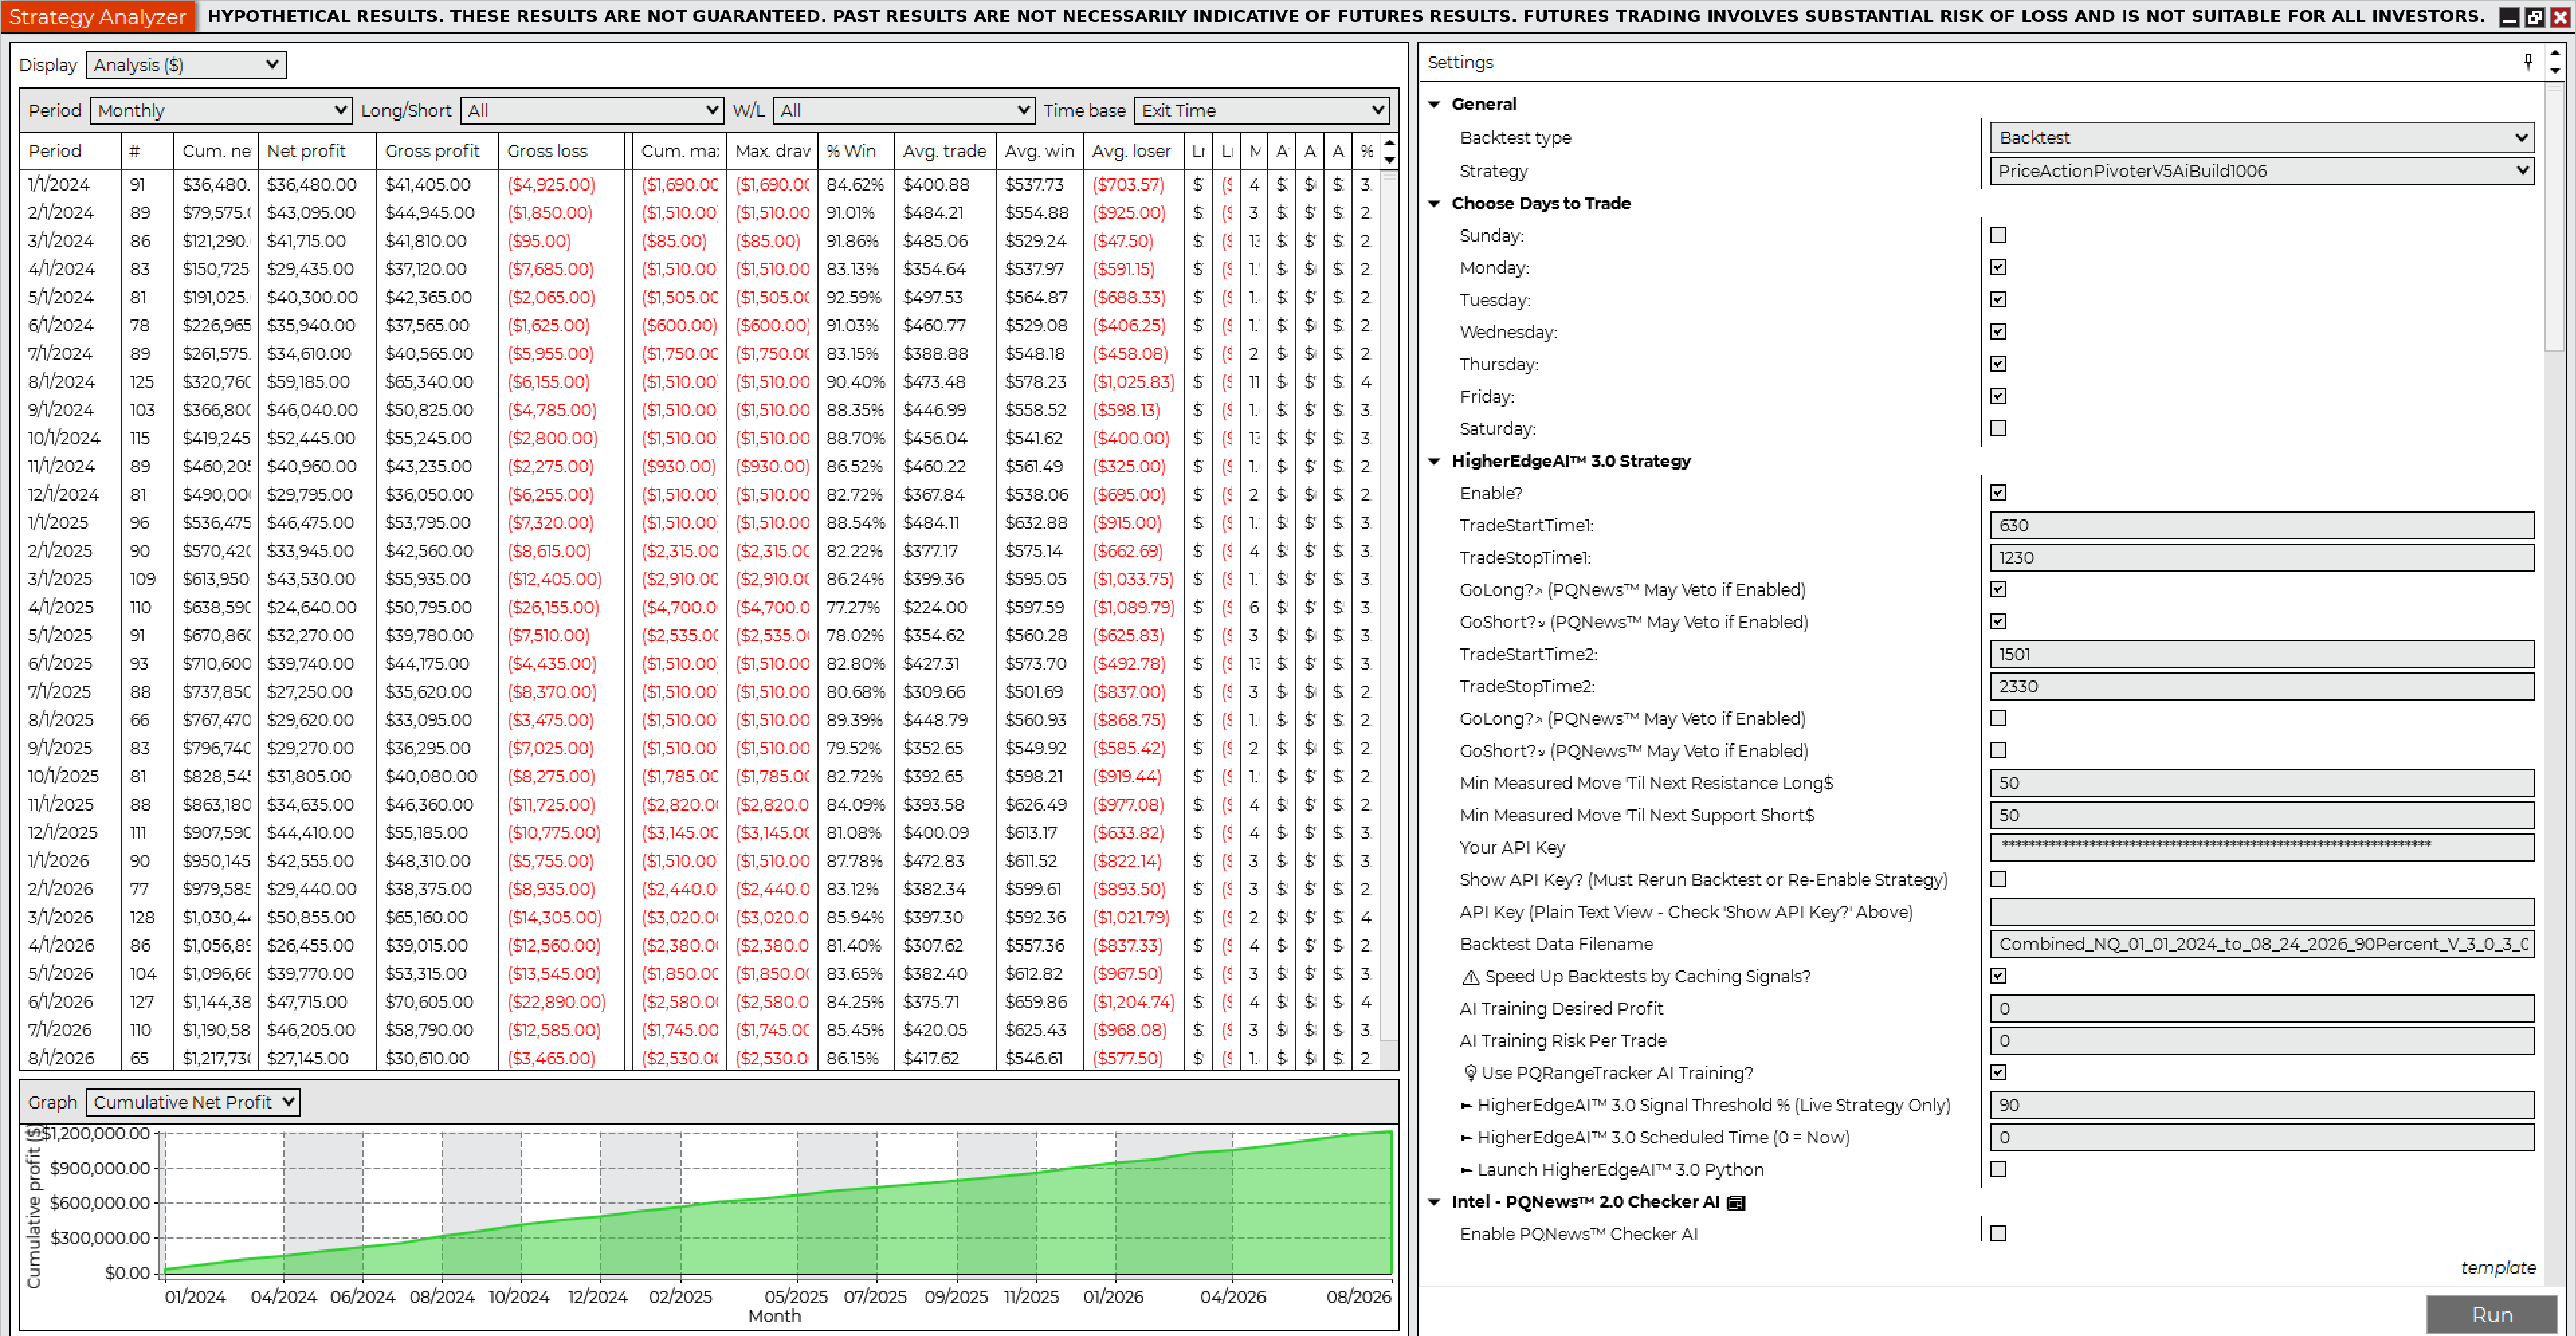
Hypothetical net profit$1,217,730.00

NinjaTrader Strategy Analyzer Summary, Backtest 7, NQ 1 Contract 90%NinjaTrader Strategy Analyzer Monthly, Backtest 7, NQ 1 Contract 90%NinjaTrader Strategy Analyzer Yearly, Backtest 7, NQ 1 Contract 90%

NinjaTrader trade details, Backtest 7
Net profit$1,217,730.00
Gross profit$1,474,325.00
Gross loss($256,595.00)
Profit factor5.75
Max drawdown($4,700.00)
Number of trades3,003
Win rate85.11%
Winning trades2,556
Losing trades321
Start date1/1/2024
End date8/24/2026
Hours traded6:30 AM – 12:30 PM Pacific
Flatten everything12:59 PM Pacific
Sortino ratio1.00
Sharpe ratio2.25
Average time in market30.56 min
Max time to recover6.82 days
Longest flat period10.77 days
Average MAE$461.55
Average MFE$735.79
Market conditionAll, incl. economic news events
Contracts1
Slippage2 ticks
CommissionNot included; e.g. $5 × 3,003 = $15,015
Backtest 8 · NinjaTrader Strategy AnalyzerNQ · 2 Contracts · 90% HigherEdgeAI™ 3.0 Confidence Threshold
Hypothetical net profit$2,435,460.00

NinjaTrader Strategy Analyzer Summary, Backtest 8, NQ 2 Contracts 90%NinjaTrader Strategy Analyzer Monthly, Backtest 8, NQ 2 Contracts 90%NinjaTrader Strategy Analyzer Yearly, Backtest 8, NQ 2 Contracts 90%

NinjaTrader trade details, Backtest 8
Net profit$2,435,460.00
Gross profit$2,948,650.00
Gross loss($513,190.00)
Profit factor5.75
Max drawdown($9,400.00)
Number of trades3,003
Win rate85.11%
Winning trades2,556
Losing trades321
Start date1/1/2024
End date8/24/2026
Hours traded6:30 AM – 12:30 PM Pacific
Flatten everything12:59 PM Pacific
Sortino ratio1.00
Sharpe ratio2.25
Average time in market30.56 min
Max time to recover6.82 days
Longest flat period10.77 days
Average MAE$923.10
Average MFE$1,471.58
Market conditionAll, incl. economic news events
Contracts2
Slippage2 ticks
CommissionNot included; e.g. $10 × 3,003 = $30,030
While no backtest is 100% accurate and past results are not necessarily indicative of future results, the above hypothetical backtests provide valuable insights into how this innovative machine learning automated trading system uses real-time A.I. signals to identify trades and manage them throughout their full lifecycle, with granular user control over entries, exits, and risk management.

Lifetime license

Pay once. Own the Price Action Pivoter™ V5Ai Suite for life.

One payment, and it is yours: updates, training and support included, no renewal, no annual data bill. Need more contracts? Additional 15-contract lots are $5,000 each. The current offer date is shown under each price.

  • Official Price Action Pivoter V5Ai - Automated Trading System

  • Fully Automated Trading System for NinjaTrader?
  • Works with Interactive Brokers?
  • Real-Time AI Trading Automated Trading Strategy?
  • Includes Machine Learning Trading Engine?
  • Three Candidate ML Models Compete?
  • Cross-Index Market Context?
  • Adjustable AI Confidence? Threshold
  • Adaptive Model Reselection Every 12 Minutes?
  • Dual-Horizon Market Probability Prediction?
  • Multivariate AI Trading Bot?
  • News & ML-Based AI Automated Trading Software?
  • Best AI Trading App for Active Traders?
  • Does the AI Trading App Include News?
  • 100% Python-Based AI Trading Bot?
  • Directional LONG and SHORT Trade Vetoes?
  • Live News-Event/ Headline News Filtering?
  • Real-Time Price-Confirmed Veto Release Logic
  • Includes Real-Time Actionable News Intelligence?
  • Gemini-Assisted Real-Time Headline Analysis?
  • Geopolitical Real-Time Headline Monitoring?
  • Scheduled Economic-Release Awareness?
  • Shared Economic-Event Intelligence?
  • What is the Trading AI Bot Called?
  • What is the AI News Bot called?
  • NinjaTrader Strategy Automatically Reads Ai Signals?
  • Tactical Scaling (Up to 3 scale-in legs)
  • NinjaTrader Trading System Controls Python Terminals?
  • Includes MidPivotPointsPHL Indicator?
  • Trading Systems Direction?
  • Can I Trade Multiple Instruments Concurrently?
  • Can Choose Days/Times to Trade?
  • Finds Trade Setups in Bull & Bear Markets?
  • Good for Prop Traders?
  • Good for Independent Traders?
  • Session High-Watermark Protection?
  • Trailing Drawdown Protection?
  • Multiple Stops Where Most Protective Stop Wins?
  • Max # of Contracts?
  • Money Management Rules?
  • Risk Management Rules?
  • Trade Management Rules?
  • Early Windfall Profit Target
  • Near-Exit Profit Lock
  • Rapid Rejection Guard (RRG)
  • Most Protective Stop Wins
  • HigherEdgeAI™ Scheduled Launch
  • Price Action & A.I. Based?
  • Ability to Backtest?
  • Signal Caching for Fast Backtesting?
  • Makes Live Simulated Trades?
  • Makes Live Cash Trades?
  • Setup on Client\\\\\\\'s Computer?
  • Setup NinjaTrader & Data Connection?
  • Type of Support Offered?
  • Includes Updates?
  • Ability to Add Custom Strategies?
  • Good for Financial Advisor (FA) Accounts?
  • Payment Type?
  • Includes Training?
  • Offer Good Through:

Live sessions

Watch the Price Action Pivoter™ V5Ai Suite trade live, with HigherEdgeAI™ 3.0 and PQNews™ 2.0 running

Recorded during live sessions on ES and NQ. You see the signals arrive, the entries, the stop management and the PQNews™ veto as they happened, with no edits.


Who We Serve

Family Offices

Asset Managers

Professional Traders

“Wealth hastily gotten will dwindle, but those who gather little by little will increase it.” – Proverbs 13:11

Raffi was interviewed by Matthias Knab on Opalesque TV during the SALT Conference in 2019, where they discussed Raffi’s trading methodology and his work at the time as an E-mini S&P 500 (ES) specialist serving hedge fund portfolio managers. The interview pre-dates Pinnacle Quant’s retail focus, but the institutional foundation it reflects is what grounds every automated trading system Raffi has built since.

Request a Zoom Demo to See the Machine Learning & Gemini News-Powered Price Action Pivoter™ Trading Suite Live!

    Do You Currently Trade Futures (ES, MES, or others)? (required)
    YesNo

    Do You Currently Trade Stocks? (required)
    YesNo

    Do You Currently Own a NinjaTrader License? (required)
    YesNo

    Do You Currently Trade with Any Automated Trading Systems? (required)
    YesNo

    What day this week are you available for a Zoom demo?

    Please choose the best time-frame for the Zoom demo:

    Please choose the preferred method:
    Regular Phone CallZoom Screen Sharing Live Demonstration

    “

    “Discover for yourself if this unique automated trading suite is a good fit for the results you are accountable to deliver.”

    Raffi Sosikian, MBAPrincipal @ Pinnacle Quant, LLC, CTA

    Bloomberg® and Bloomberg Terminal® are registered trademarks of Bloomberg Finance L.P. Pinnacle Quant, LLC is not affiliated with, endorsed by, or sponsored by Bloomberg L.P. or any of its affiliates. Bloomberg Terminal pricing shown on this page is the published 2026 single-seat list price and add-on ranges as reported by multiple industry sources; Bloomberg L.P. does not publish a public price list and actual contract terms vary. NinjaTrader® is a registered trademark of NinjaTrader, LLC. Interactive Brokers® is a registered trademark of Interactive Brokers LLC. Google Gemini is a trademark of Google LLC. All other trademarks are the property of their respective owners.

    Price Action Pivoter™, HigherEdgeAI™, PQNews™ and PinnacleQuantRangeTracker™ are trademarks of Pinnacle Quant, LLC. Licensees remain solely responsible for their own registration, disclosure, suitability and trade-allocation obligations under CFTC, NFA, SEC and state rules.

    Powered by PinnacleQuant.com