HFT Trading Software: The True Cost of Speed, the Myth of Retail Latency, and the Machine-Learning Alternative for Futures Traders

Request Live Trading Zoom Demo →

If you are searching for HFT trading software, stop before you spend. HFT is an infrastructure business: servers inside the exchange, custom chips, private microwave links. Roughly ten firms own it, and it is not for sale.

This page gives you the numbers. What HFT is. Who runs it, and who quit. When it peaked. What the survivors earn. What it costs to build. Why that cost keeps everyone else out.

The good news is that you do not need any of it. The Price Action Pivoter™ V5Ai Suite gives you fully automated futures trading driven by machine learning and real-time news filtration to ensure trades don't run counter-trend to news, on the Windows workstation you already own, for one lifetime payment. Request a Zoom demo below and watch it trade live.

CFTC Registered · CTA · NFA #0516752 · Serving 300+ Licensed Clients Worldwide Since 2018

30 to 70 min Trade horizon. Speed does not decide the trade.
ES · NQ · CL · GC Plus FDAX, SI, NG, 6E, 6B, HG and their micros.
100% automated HigherEdgeAI™ 3.0 signals. PQNews™ 2.0 news veto.
Lifetime One payment. No renewal. No per-trade fees.

What

What is HFT trading software?

HFT trading software is a purpose-built system that submits, cancels and fills orders in microseconds or nanoseconds, holds positions for milliseconds to seconds, and earns a fraction of a tick per trade across millions of trades a day. It is not a program you install. It is a data-center deployment: proprietary code, often on FPGA hardware, physically located inside the exchange’s building and connected by dedicated fiber and microwave links.

The execution speed gap

FPGA hardware (true HFT)
Under 500 nanoseconds
Optimized software, kernel-bypass networking
1 to 10 microseconds
Standard optimized software
10 to 50 microseconds
Retail platform on a Windows workstation
Milliseconds. One thousand to one million times slower.

What it does, in numbers

Order rate: a leading system places and cancels 10,000 or more orders per second.

Holding period: milliseconds to a few seconds. Positions are flat at the end of every day.

Share of the market: an estimated 50% to 60% of U.S. equity volume in 2026, from about 2% of trading firms. More than half of futures volume is algorithmic.

What it trades

Market making: quoting both sides and capturing the spread. About 72% of HFT revenue.

Latency arbitrage: seeing a price change on one venue and trading on another before it updates. Chicago-to-New-Jersey microwave is about 4 milliseconds faster than fiber. That is the whole trade.

Statistical arbitrage: trading the momentary gap between related instruments, for example SPY against ES.

None of these strategies is secret. All of them stop working the moment someone else is faster. That is why the software is inseparable from the infrastructure, and why the infrastructure is the real product.

Who

Who dominates high-frequency trading, and who has already left?

Roughly ten proprietary firms dominate HFT in 2026: Citadel Securities, Jane Street, Hudson River Trading, Jump Trading, Virtu Financial, XTX Markets, Optiver, IMC, Tower Research Capital and DRW. Most of the firms that competed with them a decade ago have closed or been absorbed.

The survivors’ numbers

Hudson River Trading reported about $6.4 billion in revenue in the first quarter of 2026 with roughly 1,000 employees, up 135% year over year. Jane Street reported about $16.1 billion in the same quarter, up 100%. Annualized, that is $18 million to $25 million of revenue per employee.

The industry that fed them

TABB Group estimated that HFT revenue from U.S. equities peaked at $7.2 billion in 2009 and fell below $1 billion by 2017, an 85% decline while the leaders kept growing. IBISWorld puts the U.S. HFT industry at $6.1 billion in 2025, shrinking at a 0.8% compound rate since 2020. The pie stopped growing; the leaders took a larger share of it.

Who shut down or sold out

Infinium Capital (Chicago)
Sold part of the business, then closed, 2014.
Chopper Trading (Chicago, ~140 staff)
Sold to DRW, January 2015.
Allston Trading (Chicago, ~100 staff)
Dropped equities in 2015 to cut costs, cut up to 25 staff in 2020, sold to DV Trading, December 2021.
Teza Technologies
Exited HFT in 2017, sold its technology to Quantlab and became a hedge fund. Its own statement: making money in HFT had grown more difficult.
Timber Hill (Interactive Brokers’ market maker)
Shut down in 2017 after 25 years, following a $22 million quarterly loss and a $25 million wind-down cost.
RGM Advisors (Austin)
Acquired by DRW, 2017.
Sun Trading (Chicago)
Acquired by Hudson River Trading, 2018.
Getco → KCG
Getco merged with Knight in 2013; the combined KCG was bought by Virtu in 2017.
Mocho Trading (Chicago)
Closed in 2017, about a year after opening.
Eladian Partners, Automat
Started in the late 2000s; closed as technology costs rose.

Of the 21 HFT firms founded between 2000 and 2010, 13 remain. The firms founded since have almost all been started by veterans of the survivors. Chicago once had several hundred proprietary trading shops. A capital-markets analyst summarized the outcome in 2017: ultra-low latency requires investment beyond the reach of most small and mid-size trading firms, and consolidation would continue. It did.

When

When did HFT start, when did it peak, and when did the door close?

HFT became possible in 1998, peaked in 2009, and closed to new entrants between 2012 and 2018.

1998
SEC Regulation ATS authorizes electronic exchanges to compete with the NYSE and Nasdaq. Electronic market making becomes a business.
2003
Algorithms execute about 15% of U.S. equity volume.
2005
SEC Regulation NMS requires orders to route to the best displayed price across venues. Cross-venue latency arbitrage becomes the dominant HFT strategy.
2009
Peak year. U.S. equity HFT revenue reaches $7.2 billion; HFT share of U.S. equity volume passes 60%.
May 6, 2010
Flash Crash. The Dow falls about 1,000 points and recovers within minutes; HFT liquidity withdrawal is cited in the SEC/CFTC report.
2010
Spread Networks completes an 827-mile straight-line Chicago–Carteret, New Jersey dark-fiber route, reported at about $300 million, cutting round-trip latency by 3 to 4 milliseconds (about 17 ms to 13 ms). Five-year leases were priced at $14 million. Microwave networks make it obsolete within two years; Zayo buys the whole route in February 2018 for $130.5 million, less than half its construction cost.
January 2012
CME Group opens co-location at its Aurora, Illinois data center. Cabinets reported at $15,000 to $19,000 per month. Futures HFT now requires renting space from the exchange.
2012
U.S. equity HFT revenue is down to $1.8 billion, one quarter of the 2009 peak.
2014
Virtu Financial’s IPO filing discloses one losing day in 1,238 trading days, on $664.5 million of 2013 revenue and $182.2 million of net income. “Flash Boys” is published the same month; Virtu postpones the IPO for a year. Public and regulatory scrutiny peaks.
2014–2018
Consolidation. Infinium closes; Chopper, RGM, Sun Trading, Teza’s technology and KCG are absorbed by DRW, HRT, Quantlab and Virtu. Timber Hill shuts after 25 years.
2017
U.S. equity HFT revenue falls below $1 billion for the first time since 2008.
2020, 2022, 2025–2026
Volatility spikes produce record revenue at the surviving firms. No meaningful new entrant appears in any of these windows.

The pattern is consistent: each step that made HFT faster also made it more expensive, and each cost increase removed another tier of participants. By the time co-location, FPGAs and microwave were all required, the entry price was in the millions and the incumbents already owned the towers.

Costs, side by side

$800,000 to $1,250,000 to Start the Smallest HFT Firm vs. One Payment for the Price Action Pivoter™ V5Ai Suite

The left column is the smallest credible HFT operation: two venues, no redundancy, figures as reported by industry sources for 2025–2026. The right column is what the Suite actually costs to run. Both have real advantages; the question is which set of advantages you can afford and can use.

Software and development
Starting an HFT firm

$200,000 to $400,000In-house build, 9 to 15 months before the first live trade. An FPGA feed handler for a single venue is reported at about $5.35 million and 3.5+ years. Doubles with redundancy.

Price Action Pivoter™ V5Ai Suite

$34,195, once, for a lifetime licenseTrade up to 15 contracts per leg, and scale in up to 3 additional legs, each up to 15 contracts. Need more contracts? Purchase 15-contract lots at only $5,000 each. Most clients are up and running in minutes. The current offer date is posted under each price below.

Hardware
Starting an HFT firm

FPGA cards, low-latency network cards and servers, all inside the co-location cabinet. Refreshed as competitors get faster.

Price Action Pivoter™ V5Ai Suite

One Windows 10+ 64-bit workstation: 3.0 GHz+ CPU, 24 GB RAM for one instrument or 32 GB for two, 10 GB SSD, wired internet. Hardware you already own or can buy for a few thousand dollars.

Exchange access
Starting an HFT firm

$15,000 to $19,000 per monthOne co-location cabinet at CME Aurora, plus a $10,000 deposit. Direct membership and proprietary feeds add about $200,000 up front and $20,000 per month per venue.

Price Action Pivoter™ V5Ai Suite

Your broker’s connection through NinjaTrader Brokerage or Interactive Brokers. No cabinet, no membership, no deposit.

Market data
Starting an HFT firm

$5,000 to $50,000+ per monthPer exchange, for raw low-latency feeds.

Price Action Pivoter™ V5Ai Suite

Standard futures data from your broker at retail rates.

Platform and news
Starting an HFT firm

A custom C++ or FPGA stack maintained by your own staff, plus a low-latency institutional news feed priced per seat.

Price Action Pivoter™ V5Ai Suite

$0 to $99 per monthTrading through NinjaTrader Brokerage, the NinjaTrader 8 platform is included at no charge. Trading through Interactive Brokers requires the NinjaTrader Multi-Broker license at $99 per month. Either way, add your own Google Gemini API key on Google’s pay-as-you-go pricing for PQNews™ 2.0.

Staff
Starting an HFT firm

Quant developers, FPGA engineers, network engineers and compliance. Software maintenance alone runs 15% to 25% of the build cost every year.

Price Action Pivoter™ V5Ai Suite

None. Updates, training and support are included for the life of the license.

Capital tied up
Starting an HFT firm

Several million dollars of clearing collateral before the first trade, on top of trading capital.

Price Action Pivoter™ V5Ai Suite

The margin your broker requires for the contracts you trade. Nothing else.

What the money buys
Starting an HFT firm

Thousands of tiny spread-capture trades a day with almost no directional risk, and exchange rebates for providing liquidity. Revenue rises with volatility and compresses when markets are quiet, while the fixed costs run every month.

Price Action Pivoter™ V5Ai Suite

A fully automated trading system that runs multiple multivariate LSTM models that compete to pick the top ML model, checks the news via Gemini’s API in real time so trades don’t run counter-trend to news, manages the trade entries, exits, trailing stops (various kinds), stop and profit target, scales additional trades each with their own trailing stops, stops and profit targets, and provides you with several tiers of money management including high-watermark protection. Trades last 30 to 70 minutes, so speed does not decide them.

Year-one total
Starting an HFT firm

$800,000 to $1,250,000$200,000 to $400,000 of build plus $600,000 to $850,000 of operating cost, before collateral and trading capital.

Price Action Pivoter™ V5Ai Suite

$34,195 to about $35,000The license, plus $1,188 of NinjaTrader fees only if you trade through Interactive Brokers, plus Gemini API usage and broker data.

Every year after
Starting an HFT firm

$600,000 to $850,000Co-location, data, staff and maintenance, whether or not the year is volatile enough to pay for them.

Price Action Pivoter™ V5Ai Suite

$0 to about $1,188Nothing for the Suite. $1,188 a year for the NinjaTrader license only if you trade through Interactive Brokers, plus Gemini API usage and broker data.

The difference: roughly $766,000 to $1,218,000 in year one, and $599,000 to $850,000 every year after, before the several million dollars of clearing collateral an HFT firm must post. That money stays in your trading account instead.

HFT figures are as reported by industry sources for 2025–2026 and are approximate; exchanges and vendors do not publish uniform price lists. Suite figures are the current license price and the NinjaTrader Multi-Broker fee that applies when trading through Interactive Brokers; Gemini API and broker data charges depend on usage and provider.

Hypothetical performance

Thirty-two months of backtests, published in full, trade by trade

January 1, 2024 through August 24, 2026, Regular Trading Hours only, one-minute bars calculated on bar close, two ticks of slippage, commissions excluded, core parameters held constant for the entire period. HigherEdgeAI™ 3.0 training objectives were selected automatically by PinnacleQuantRangeTracker™. Every run includes the HigherEdgeAI™ signal files, a trade-by-trade file and the dashboard PDF with the exact parameters, so you can rebuild it yourself in NinjaTrader’s Strategy Analyzer. Not curve-fitted; no Renko or Heiken-Ashi bars.

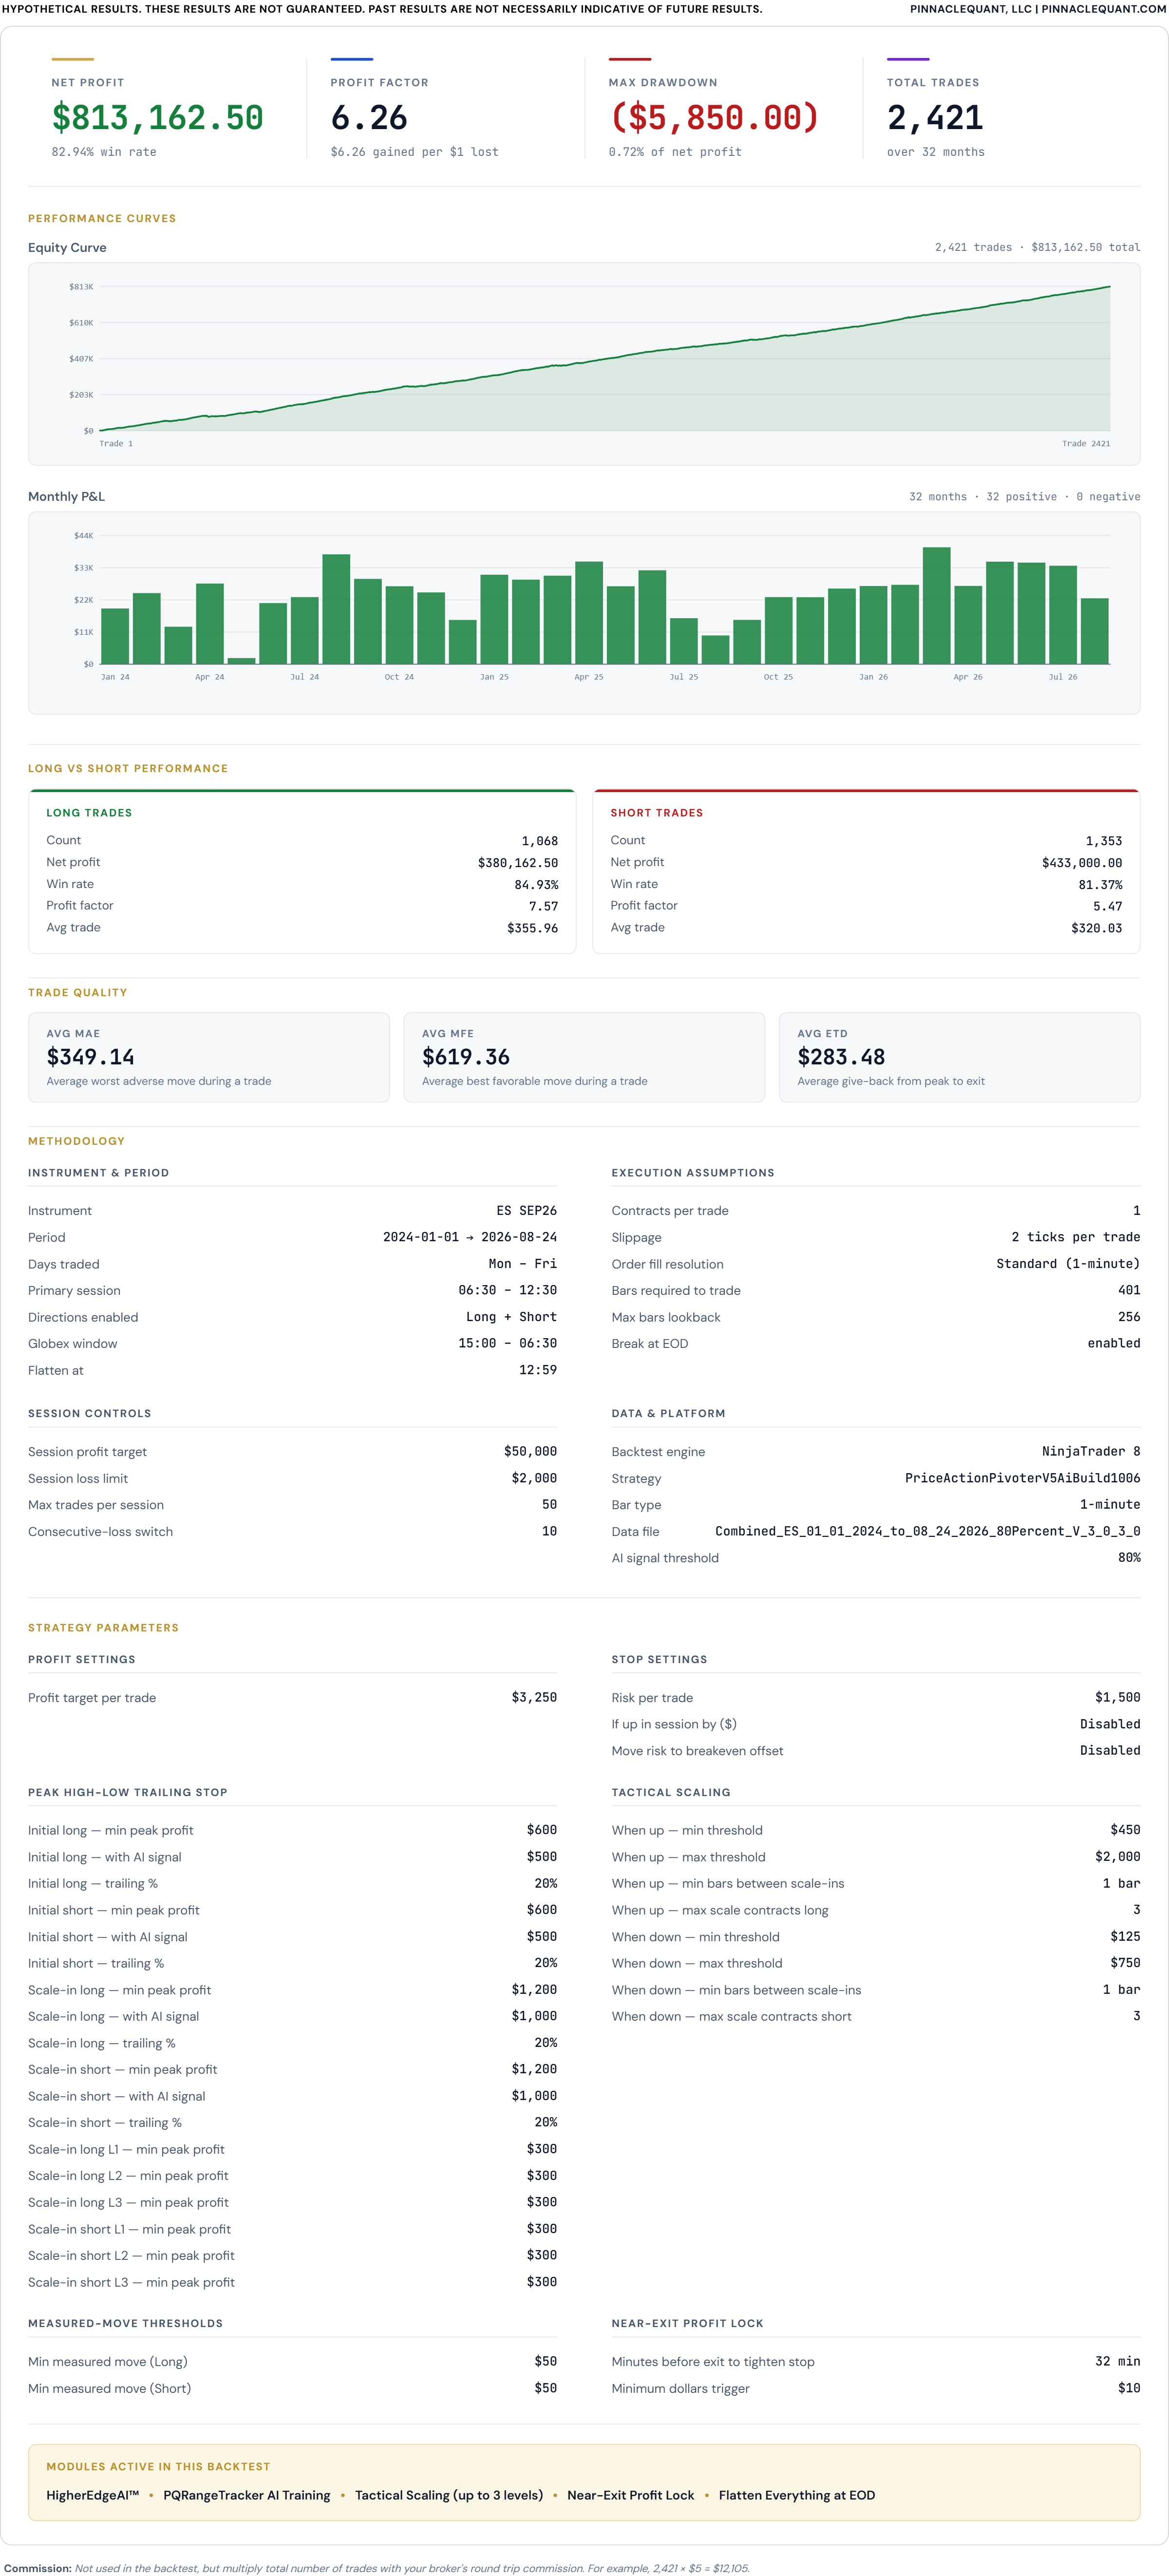
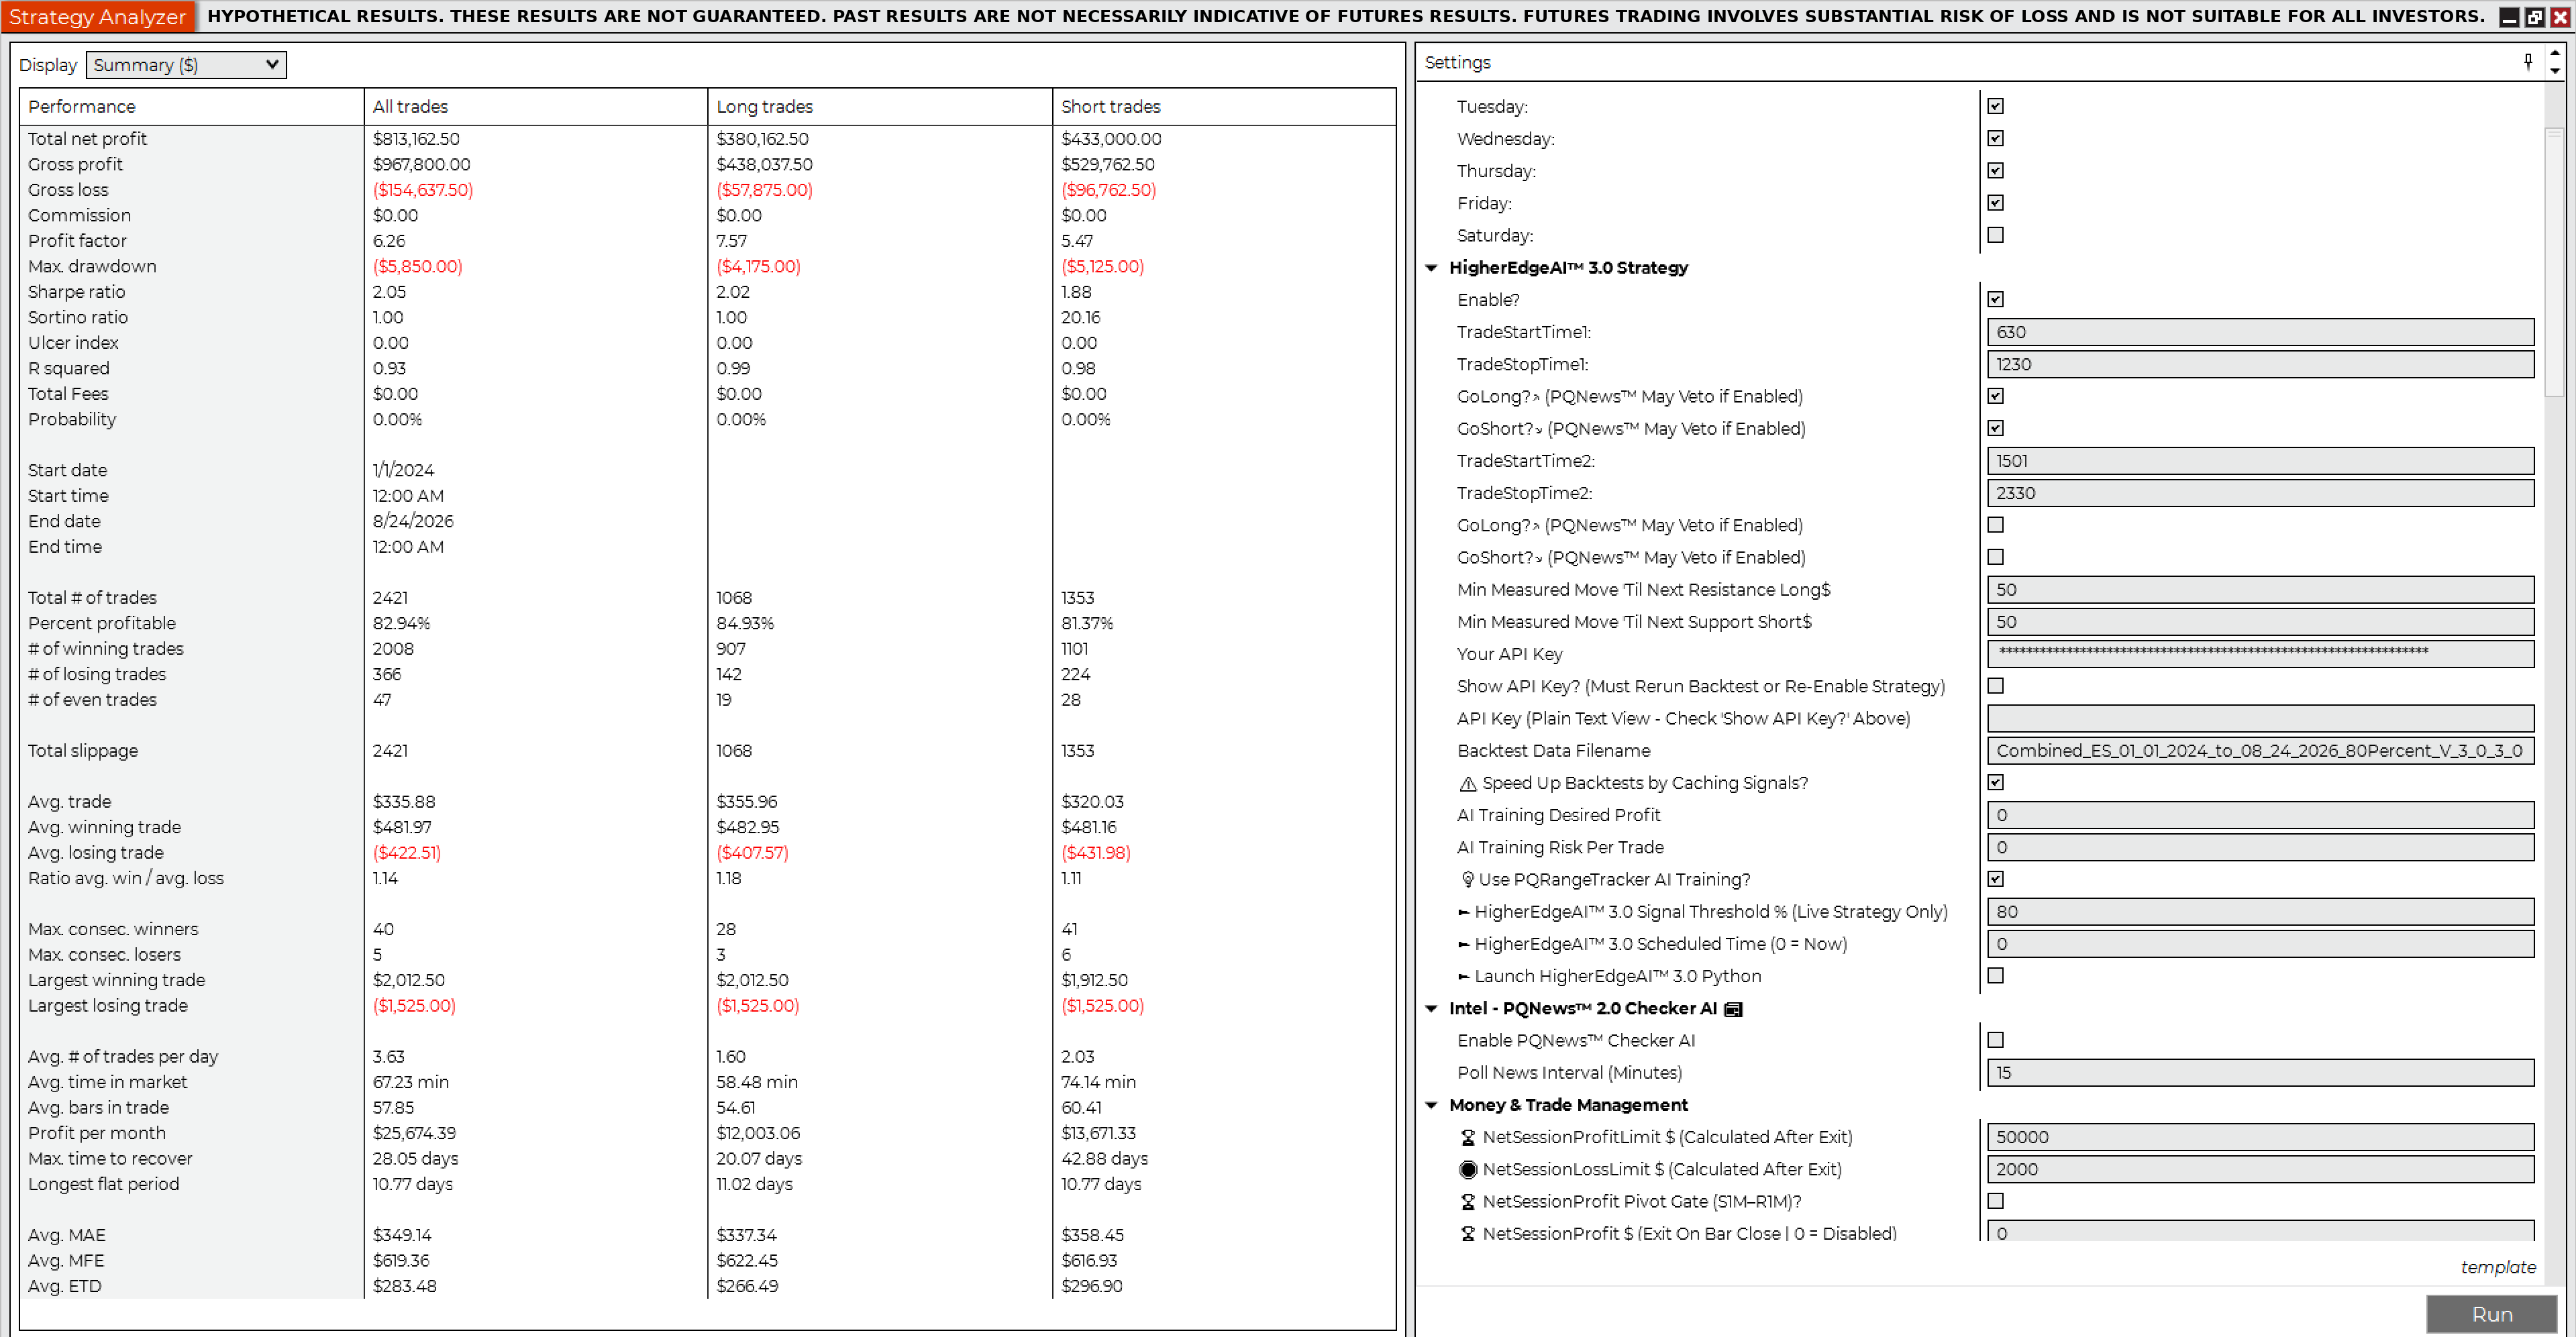
Backtest 1 · ES · 1 Contract · 80% HigherEdgeAI™ 3.0 confidence
Net profit $813,162.50
Gross profit$967,800.00
Gross loss($154,637.50)
Profit factor6.26
Max drawdown($5,850.00)
Trades2,421
Win rate82.94%
Winning trades2,008
Losing trades366
Sharpe ratio2.05
Sortino ratio1.00
Avg time in market67.23 min
Max time to recover28.05 days
Longest flat period10.77 days
Average MAE$349.14
Average MFE$619.36
Contracts · slippage1 · 2 ticks
Jan 1, 2024 – Aug 24, 2026 · RTH 6:30 AM – 12:30 PM Pacific, flat by 12:59 PM · all market conditions including economic news events · commissions excluded (example: $5 × 2,421 = $12,105 round-trip).
Backtest 2 · ES · 2 Contracts · 80% HigherEdgeAI™ 3.0 confidence
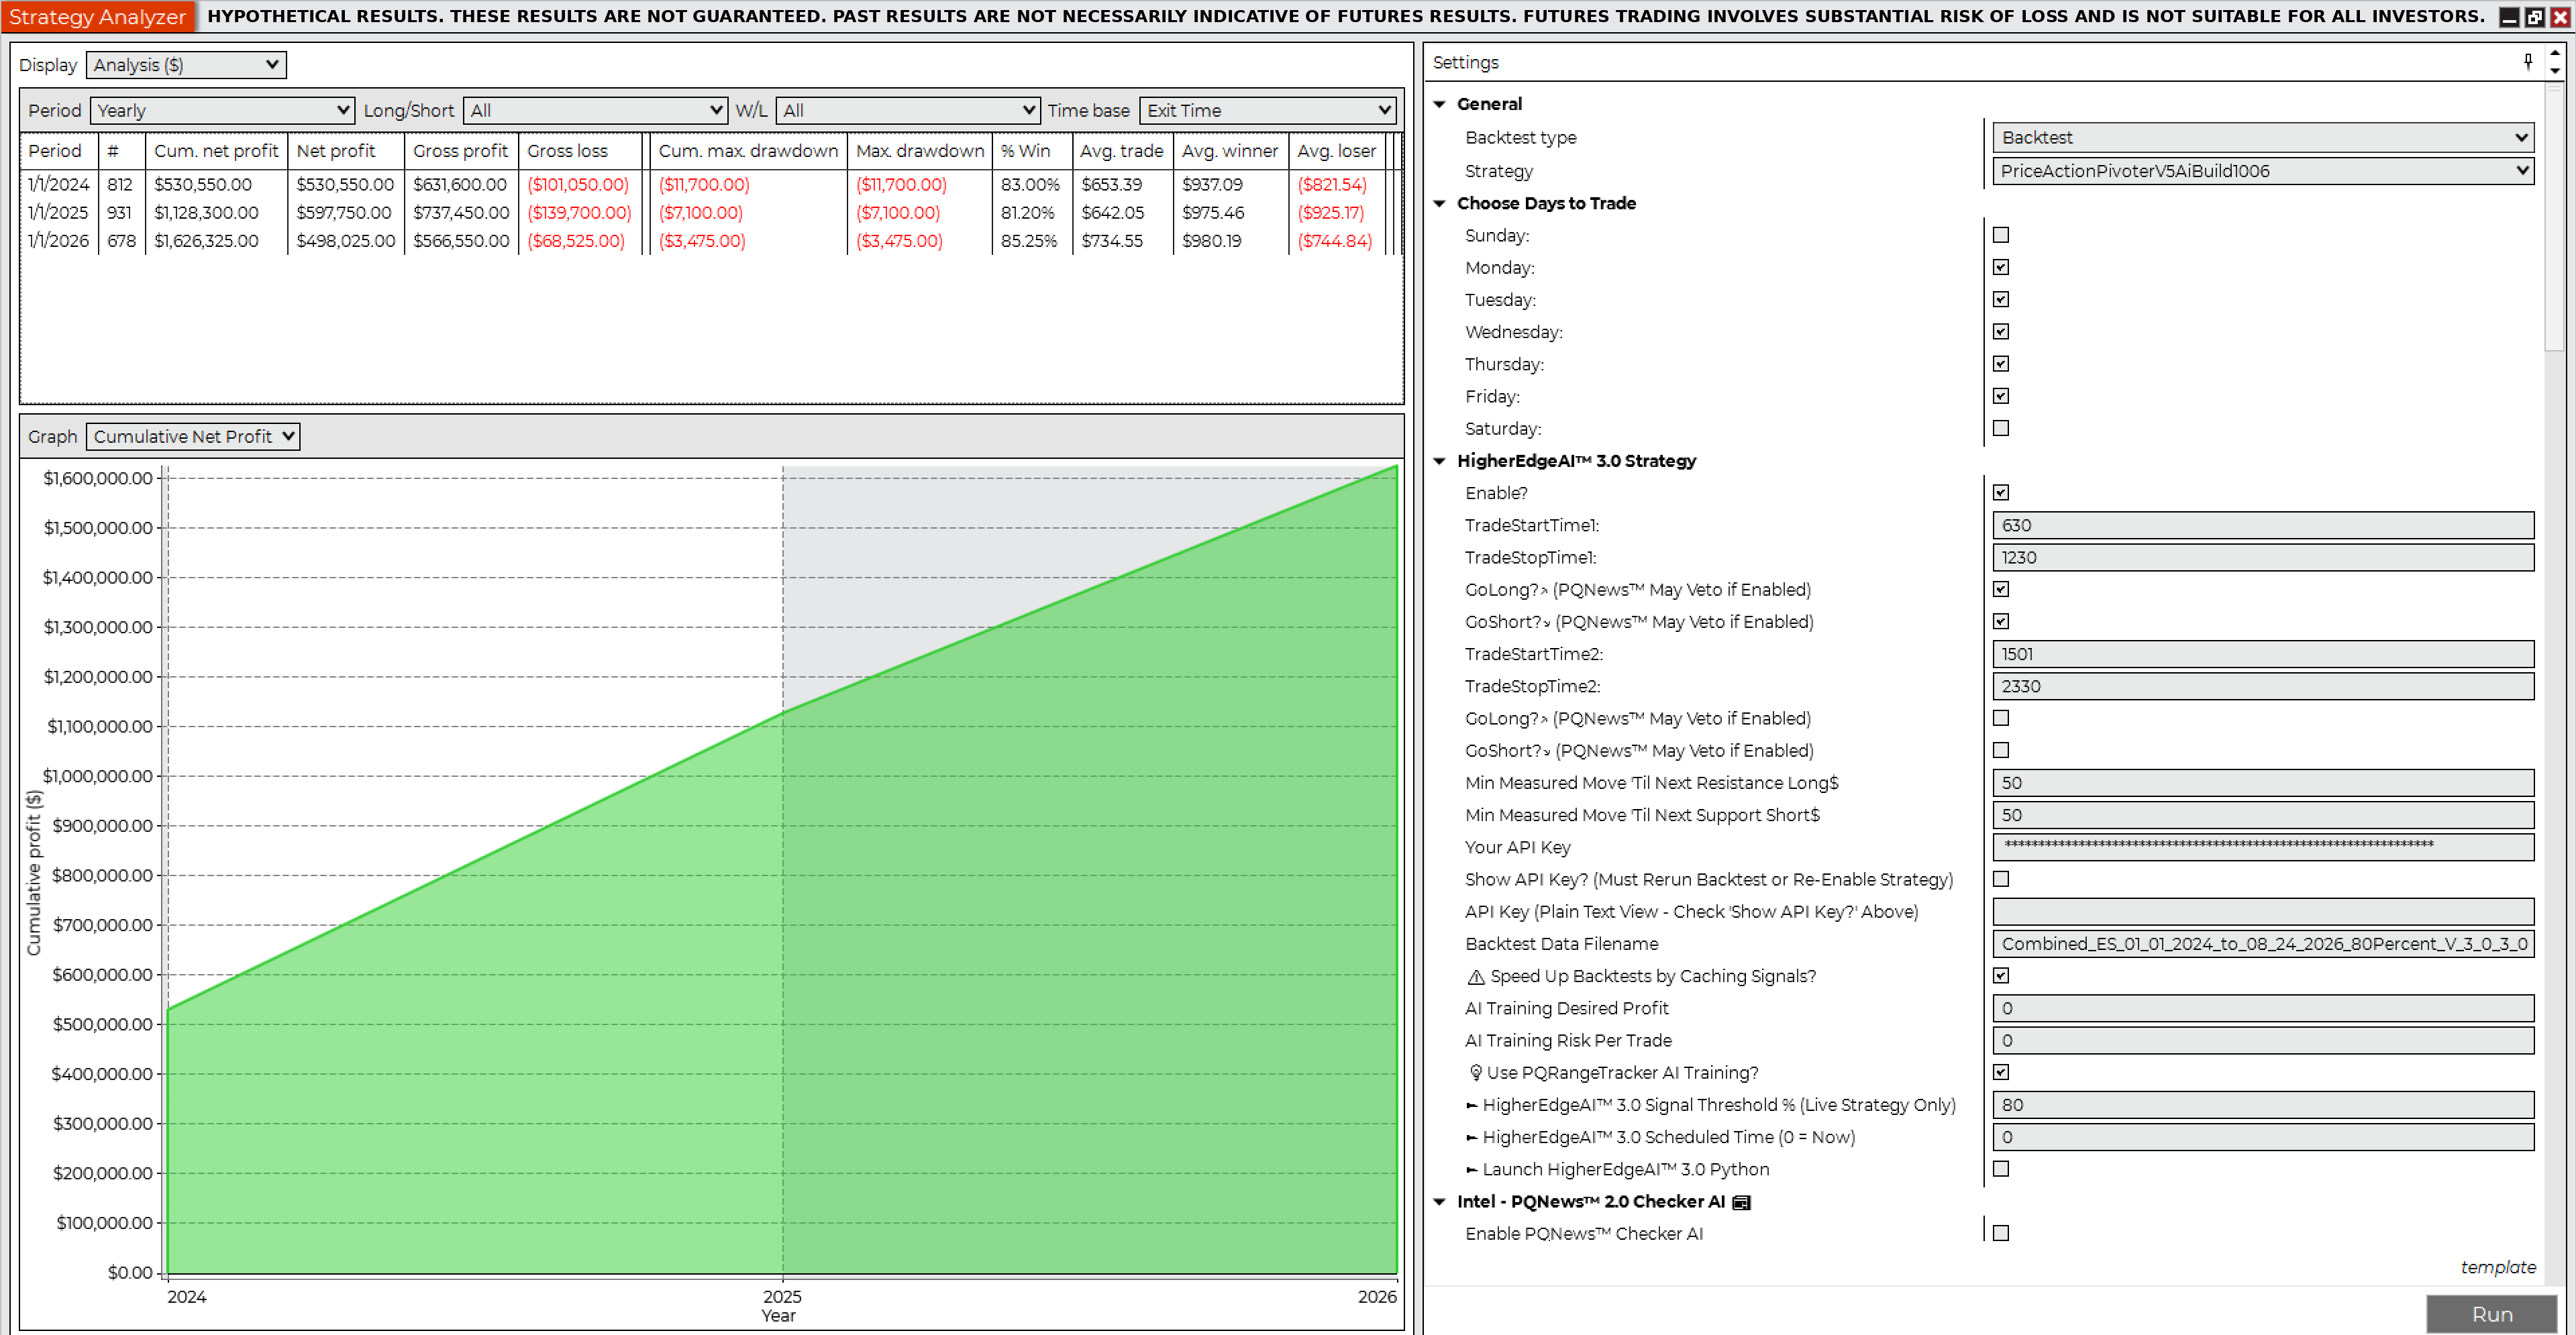
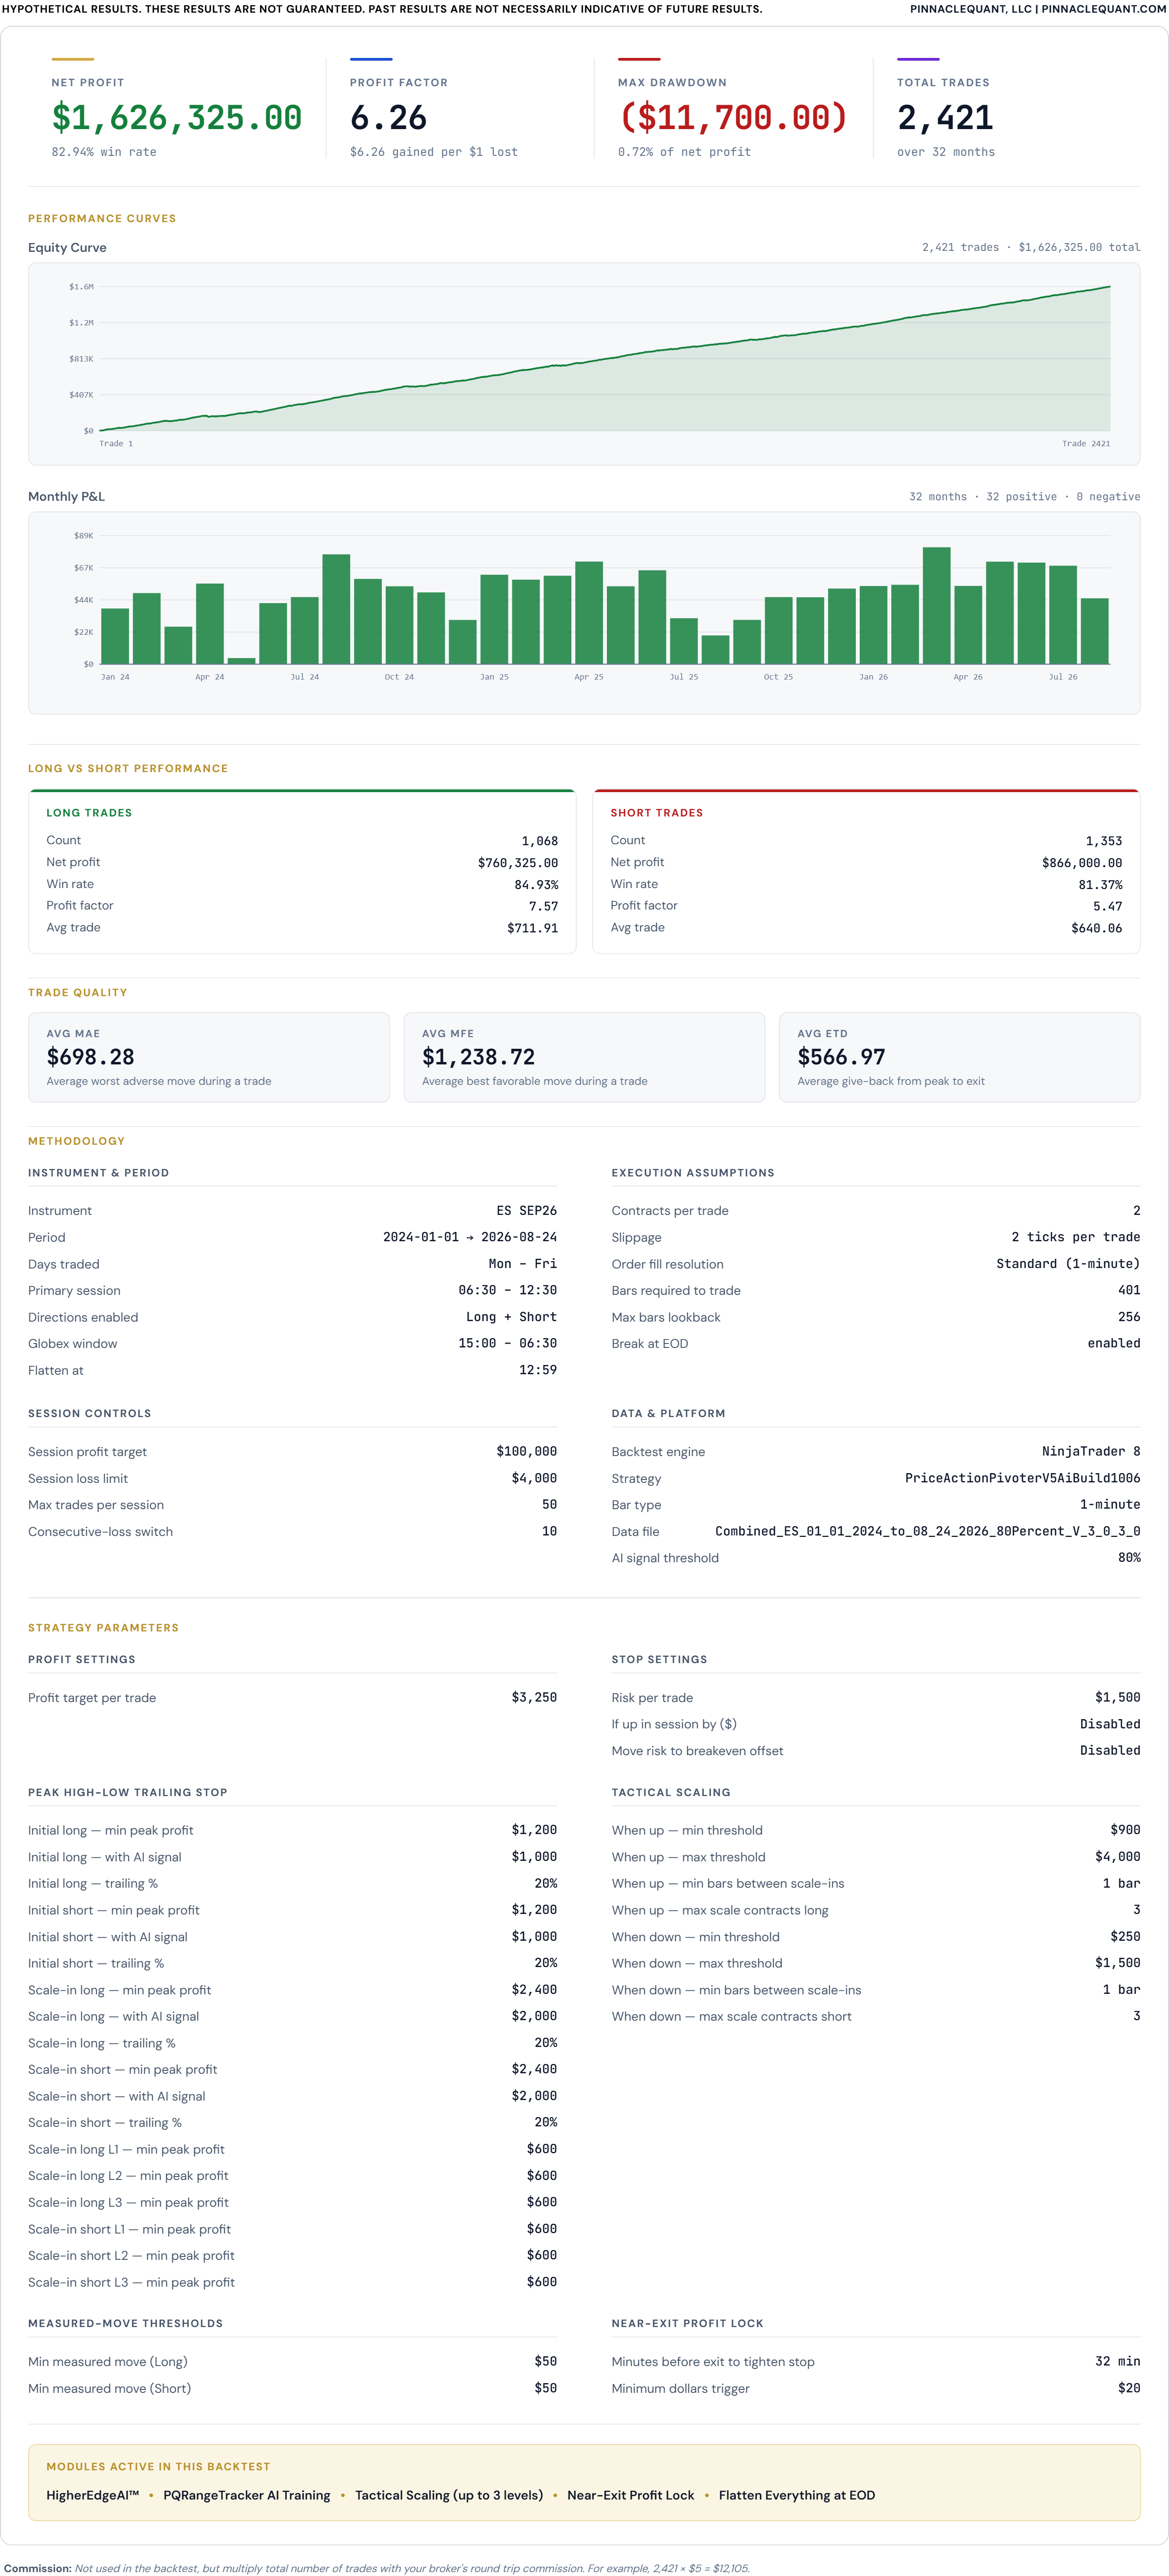
Net profit $1,626,325.00
Gross profit$1,935,600.00
Gross loss($309,275.00)
Profit factor6.26
Max drawdown($11,700.00)
Trades2,421
Win rate82.94%
Winning trades2,008
Losing trades366
Sharpe ratio2.05
Sortino ratio1.00
Avg time in market67.23 min
Max time to recover28.05 days
Longest flat period10.77 days
Average MAE$698.28
Average MFE$1,238.72
Contracts · slippage2 · 2 ticks
Jan 1, 2024 – Aug 24, 2026 · RTH 6:30 AM – 12:30 PM Pacific, flat by 12:59 PM · all market conditions including economic news events · commissions excluded (example: $10 × 2,421 = $24,210 round-trip).
Backtest 3 · ES · 1 Contract · 90% HigherEdgeAI™ 3.0 confidence
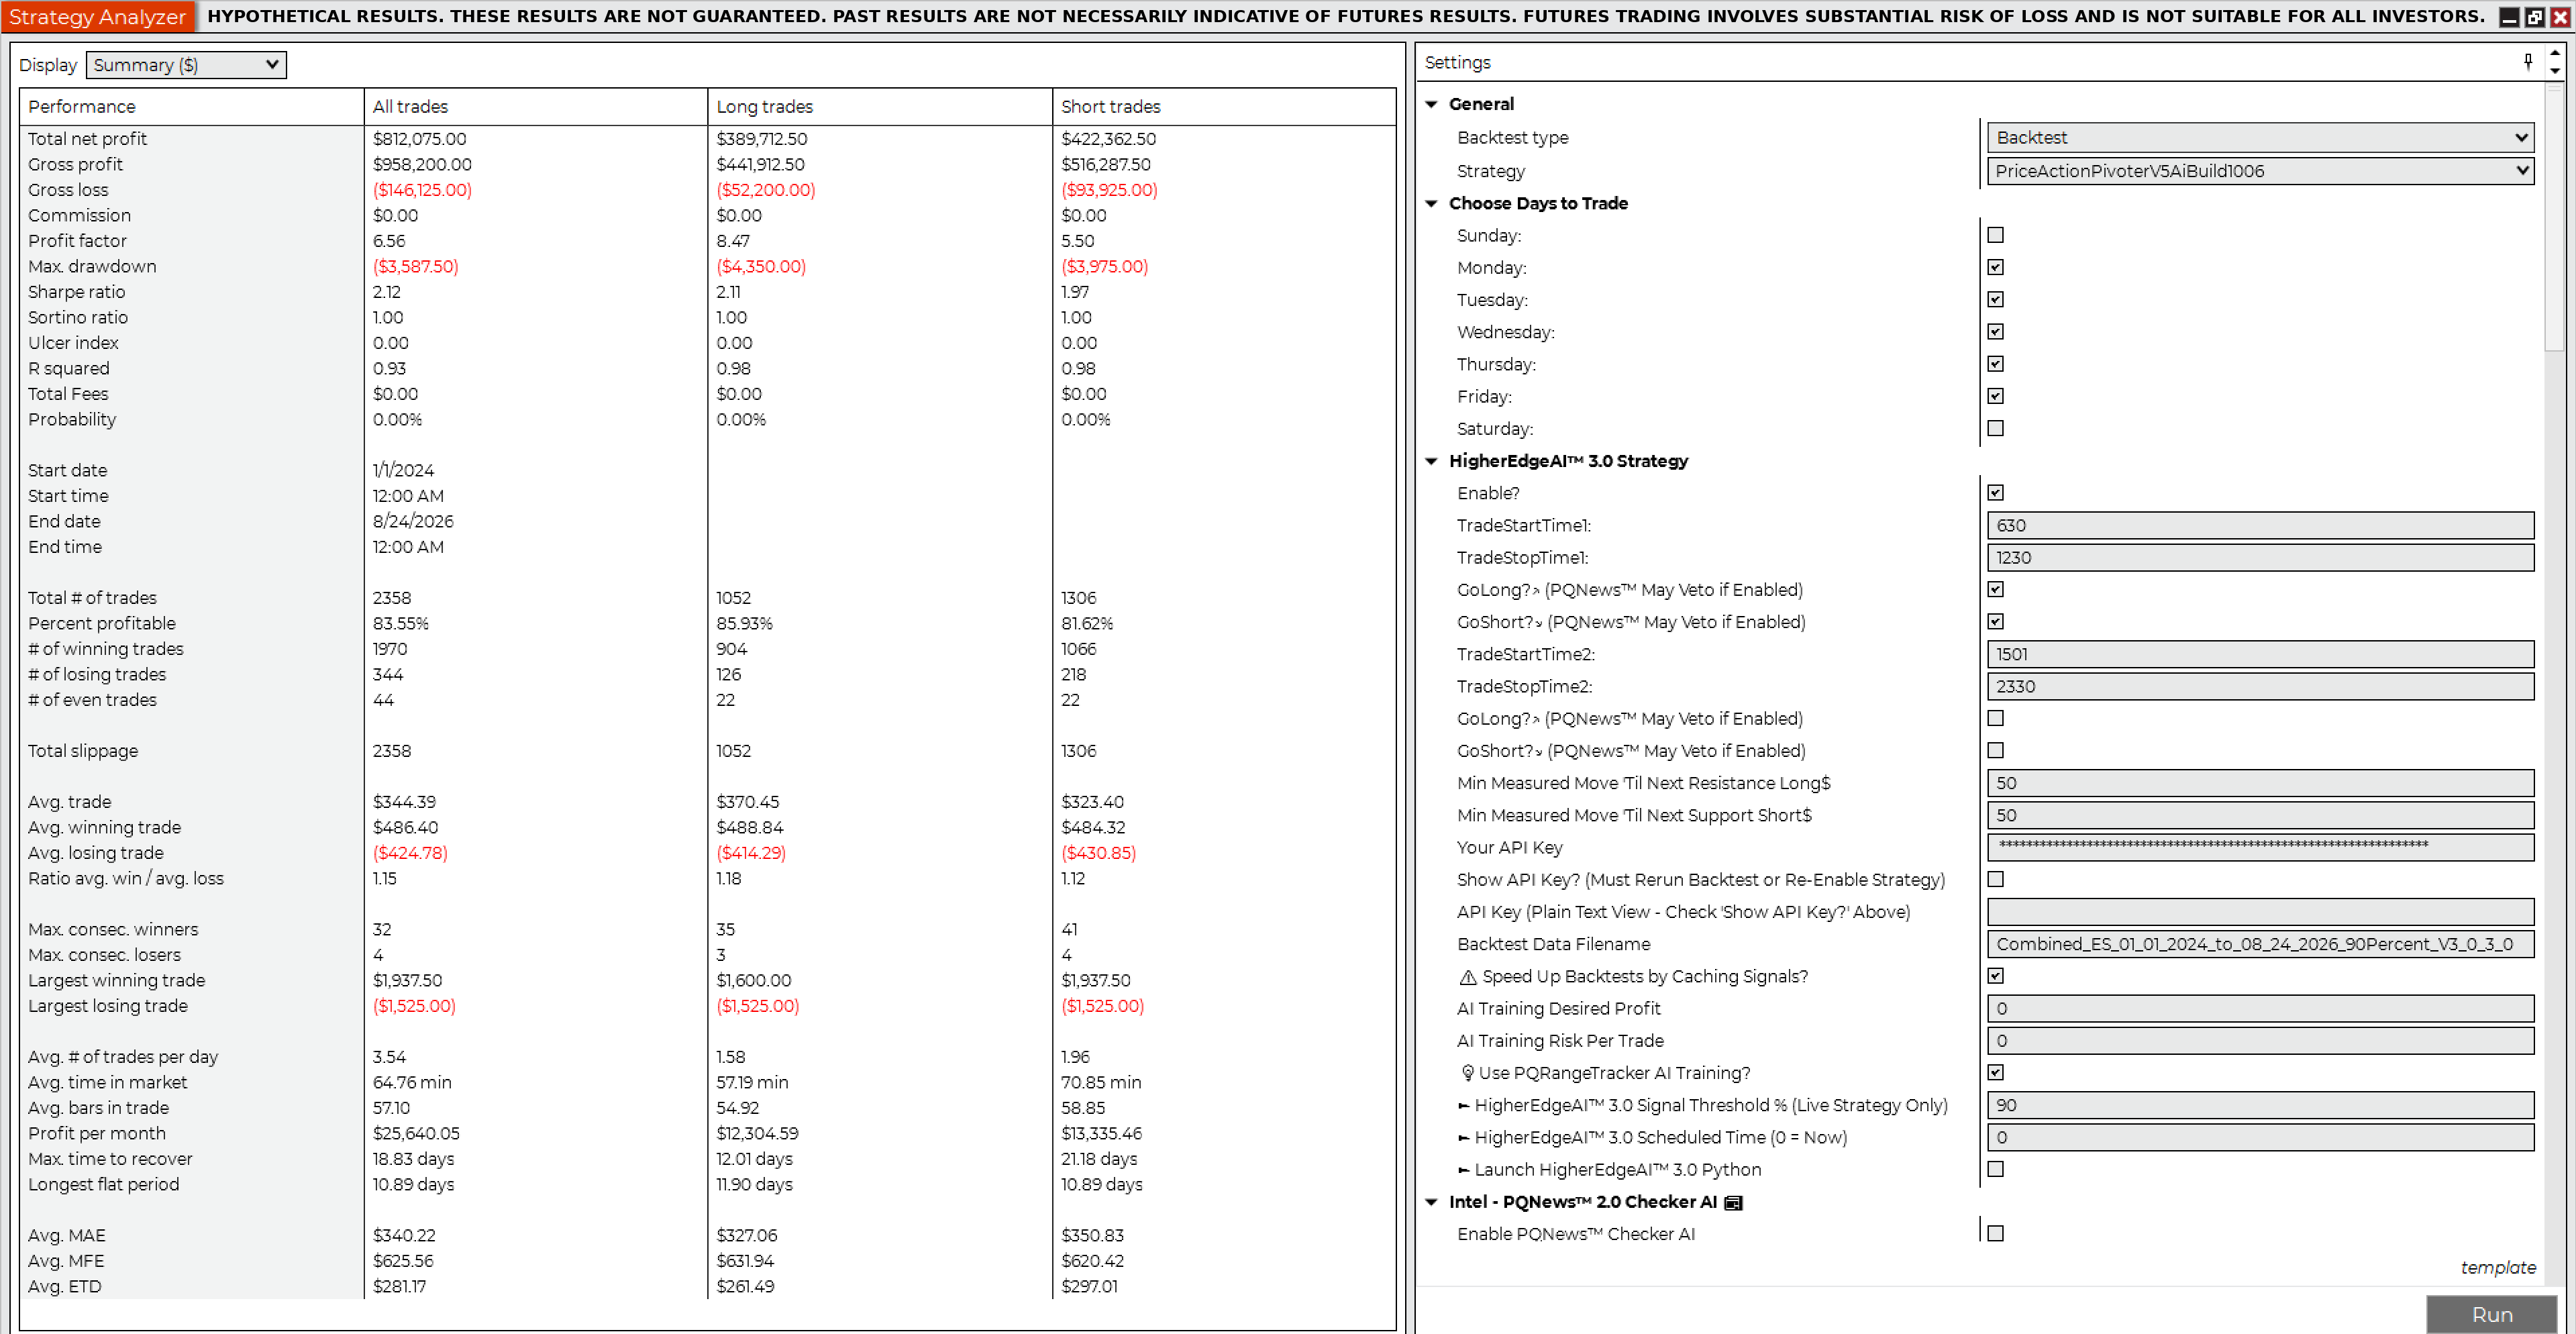
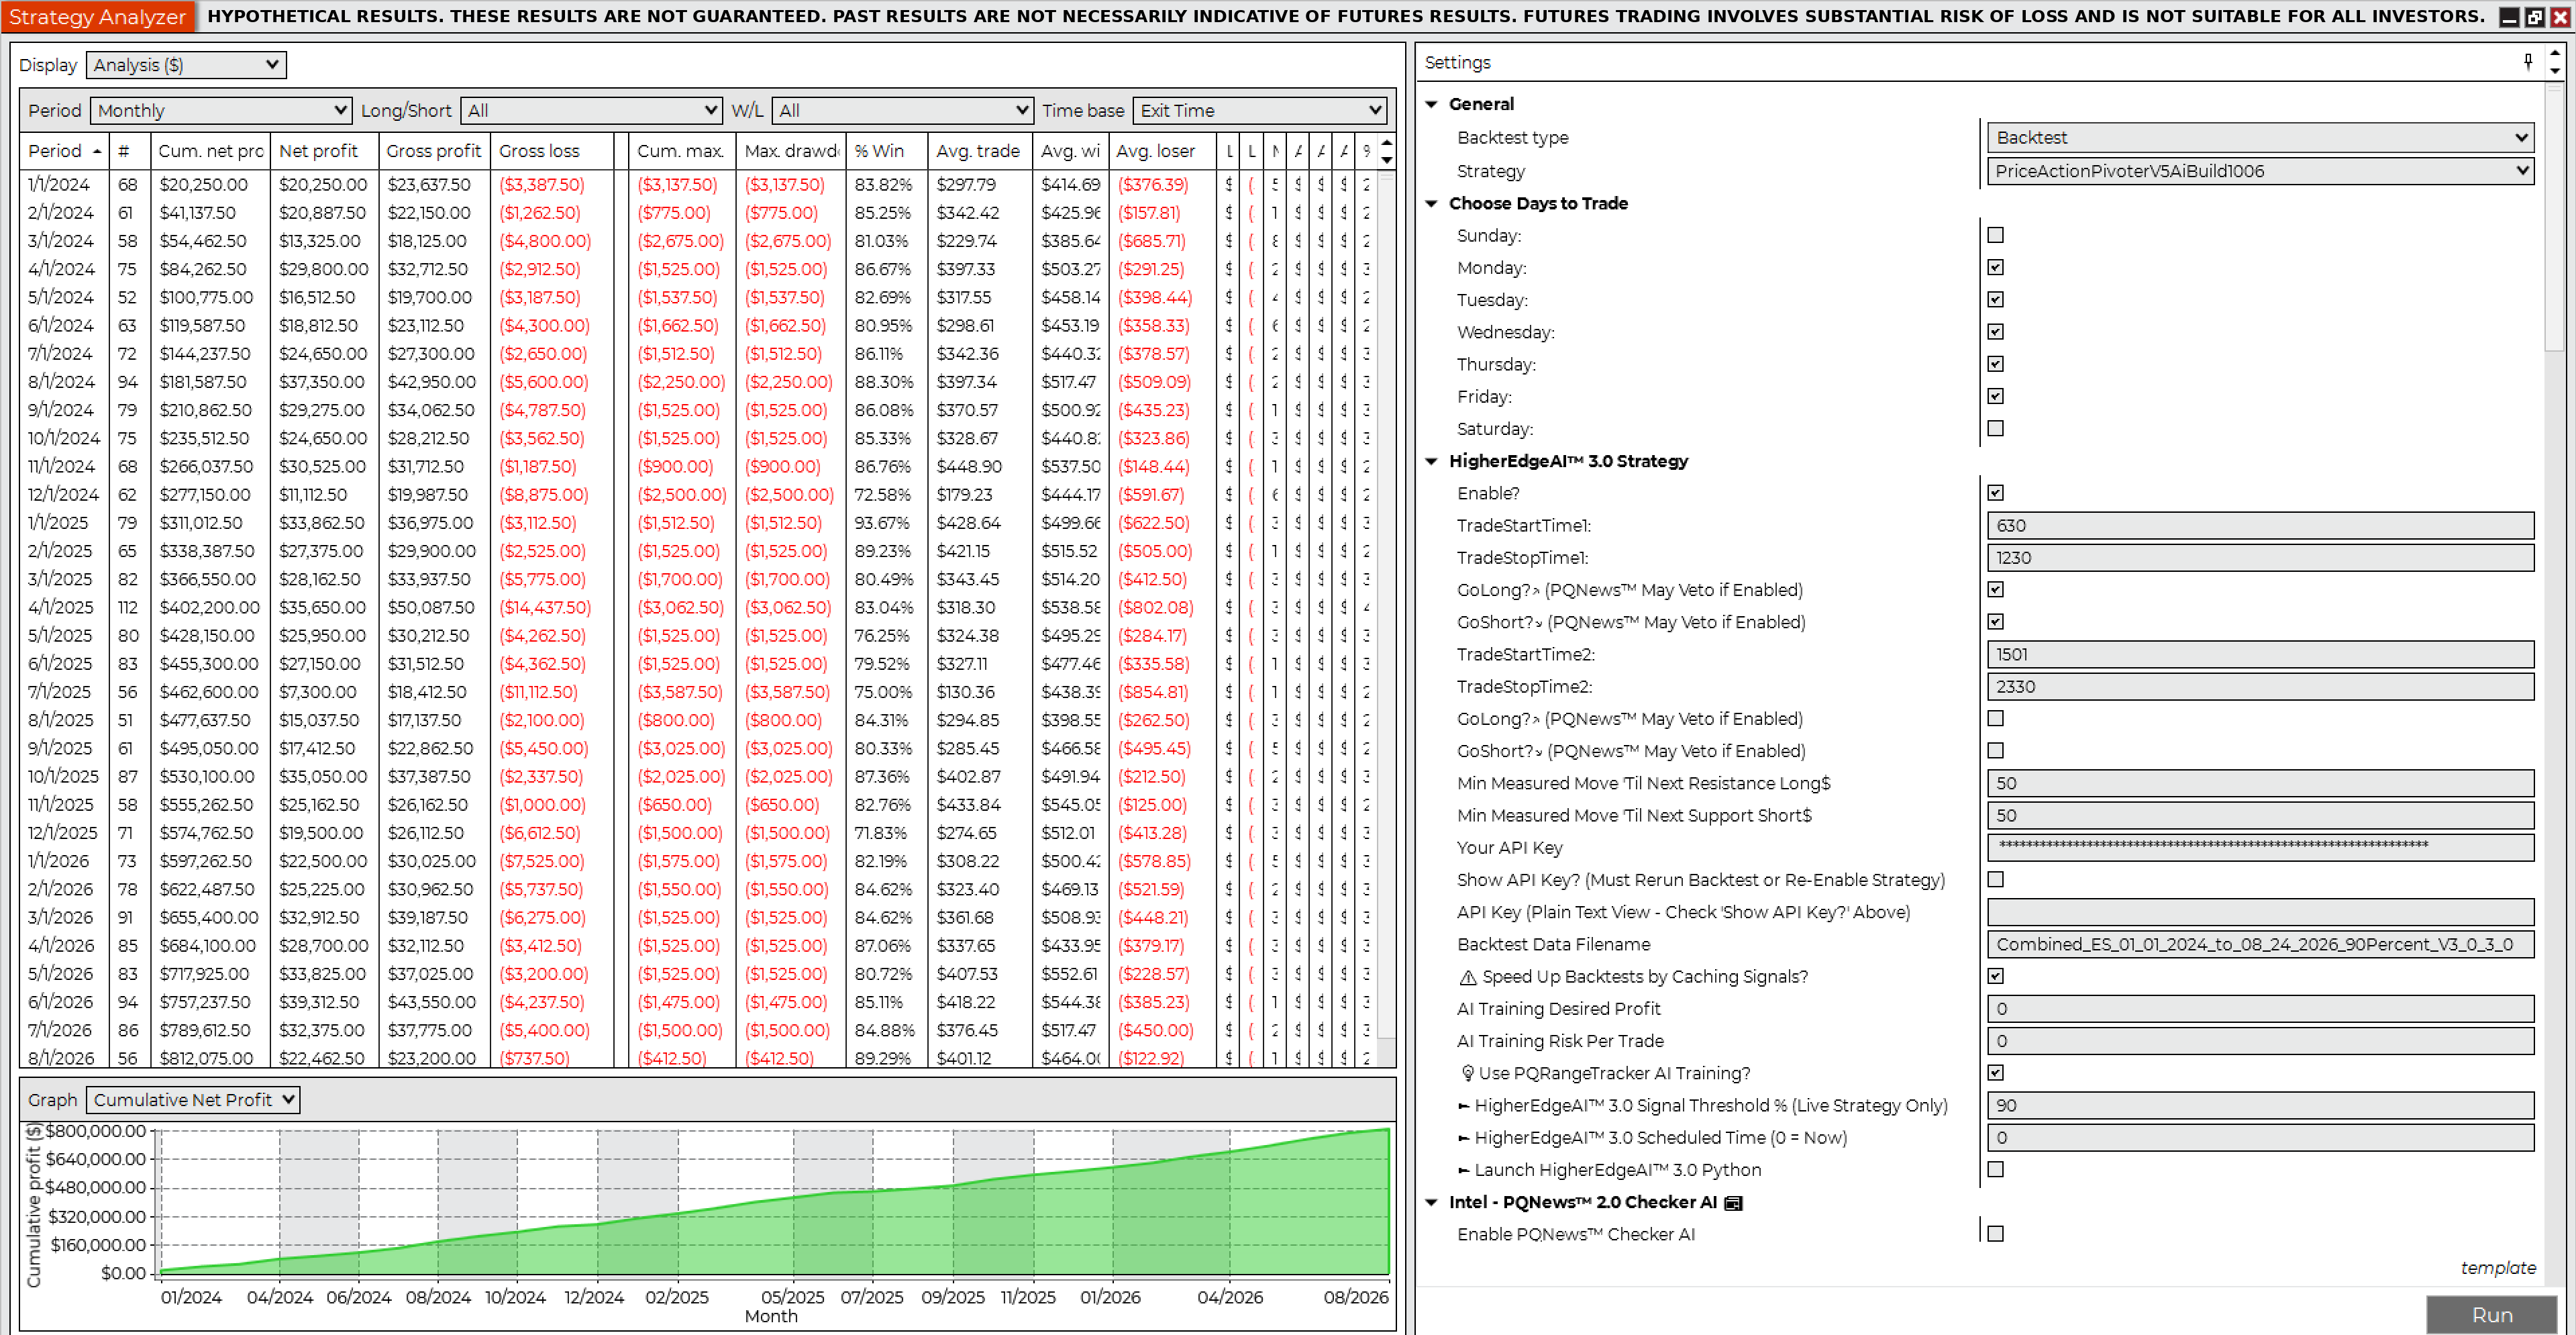
Net profit $812,075.00
Gross profit$958,200.00
Gross loss($146,125.00)
Profit factor6.56
Max drawdown($3,587.50)
Trades2,358
Win rate83.55%
Winning trades1,970
Losing trades344
Sharpe ratio2.12
Sortino ratio1.00
Avg time in market64.76 min
Max time to recover18.83 days
Longest flat period10.89 days
Average MAE$340.22
Average MFE$625.56
Contracts · slippage1 · 2 ticks
Jan 1, 2024 – Aug 24, 2026 · RTH 6:30 AM – 12:30 PM Pacific, flat by 12:59 PM · all market conditions including economic news events · commissions excluded (example: $5 × 2,358 = $11,790 round-trip).
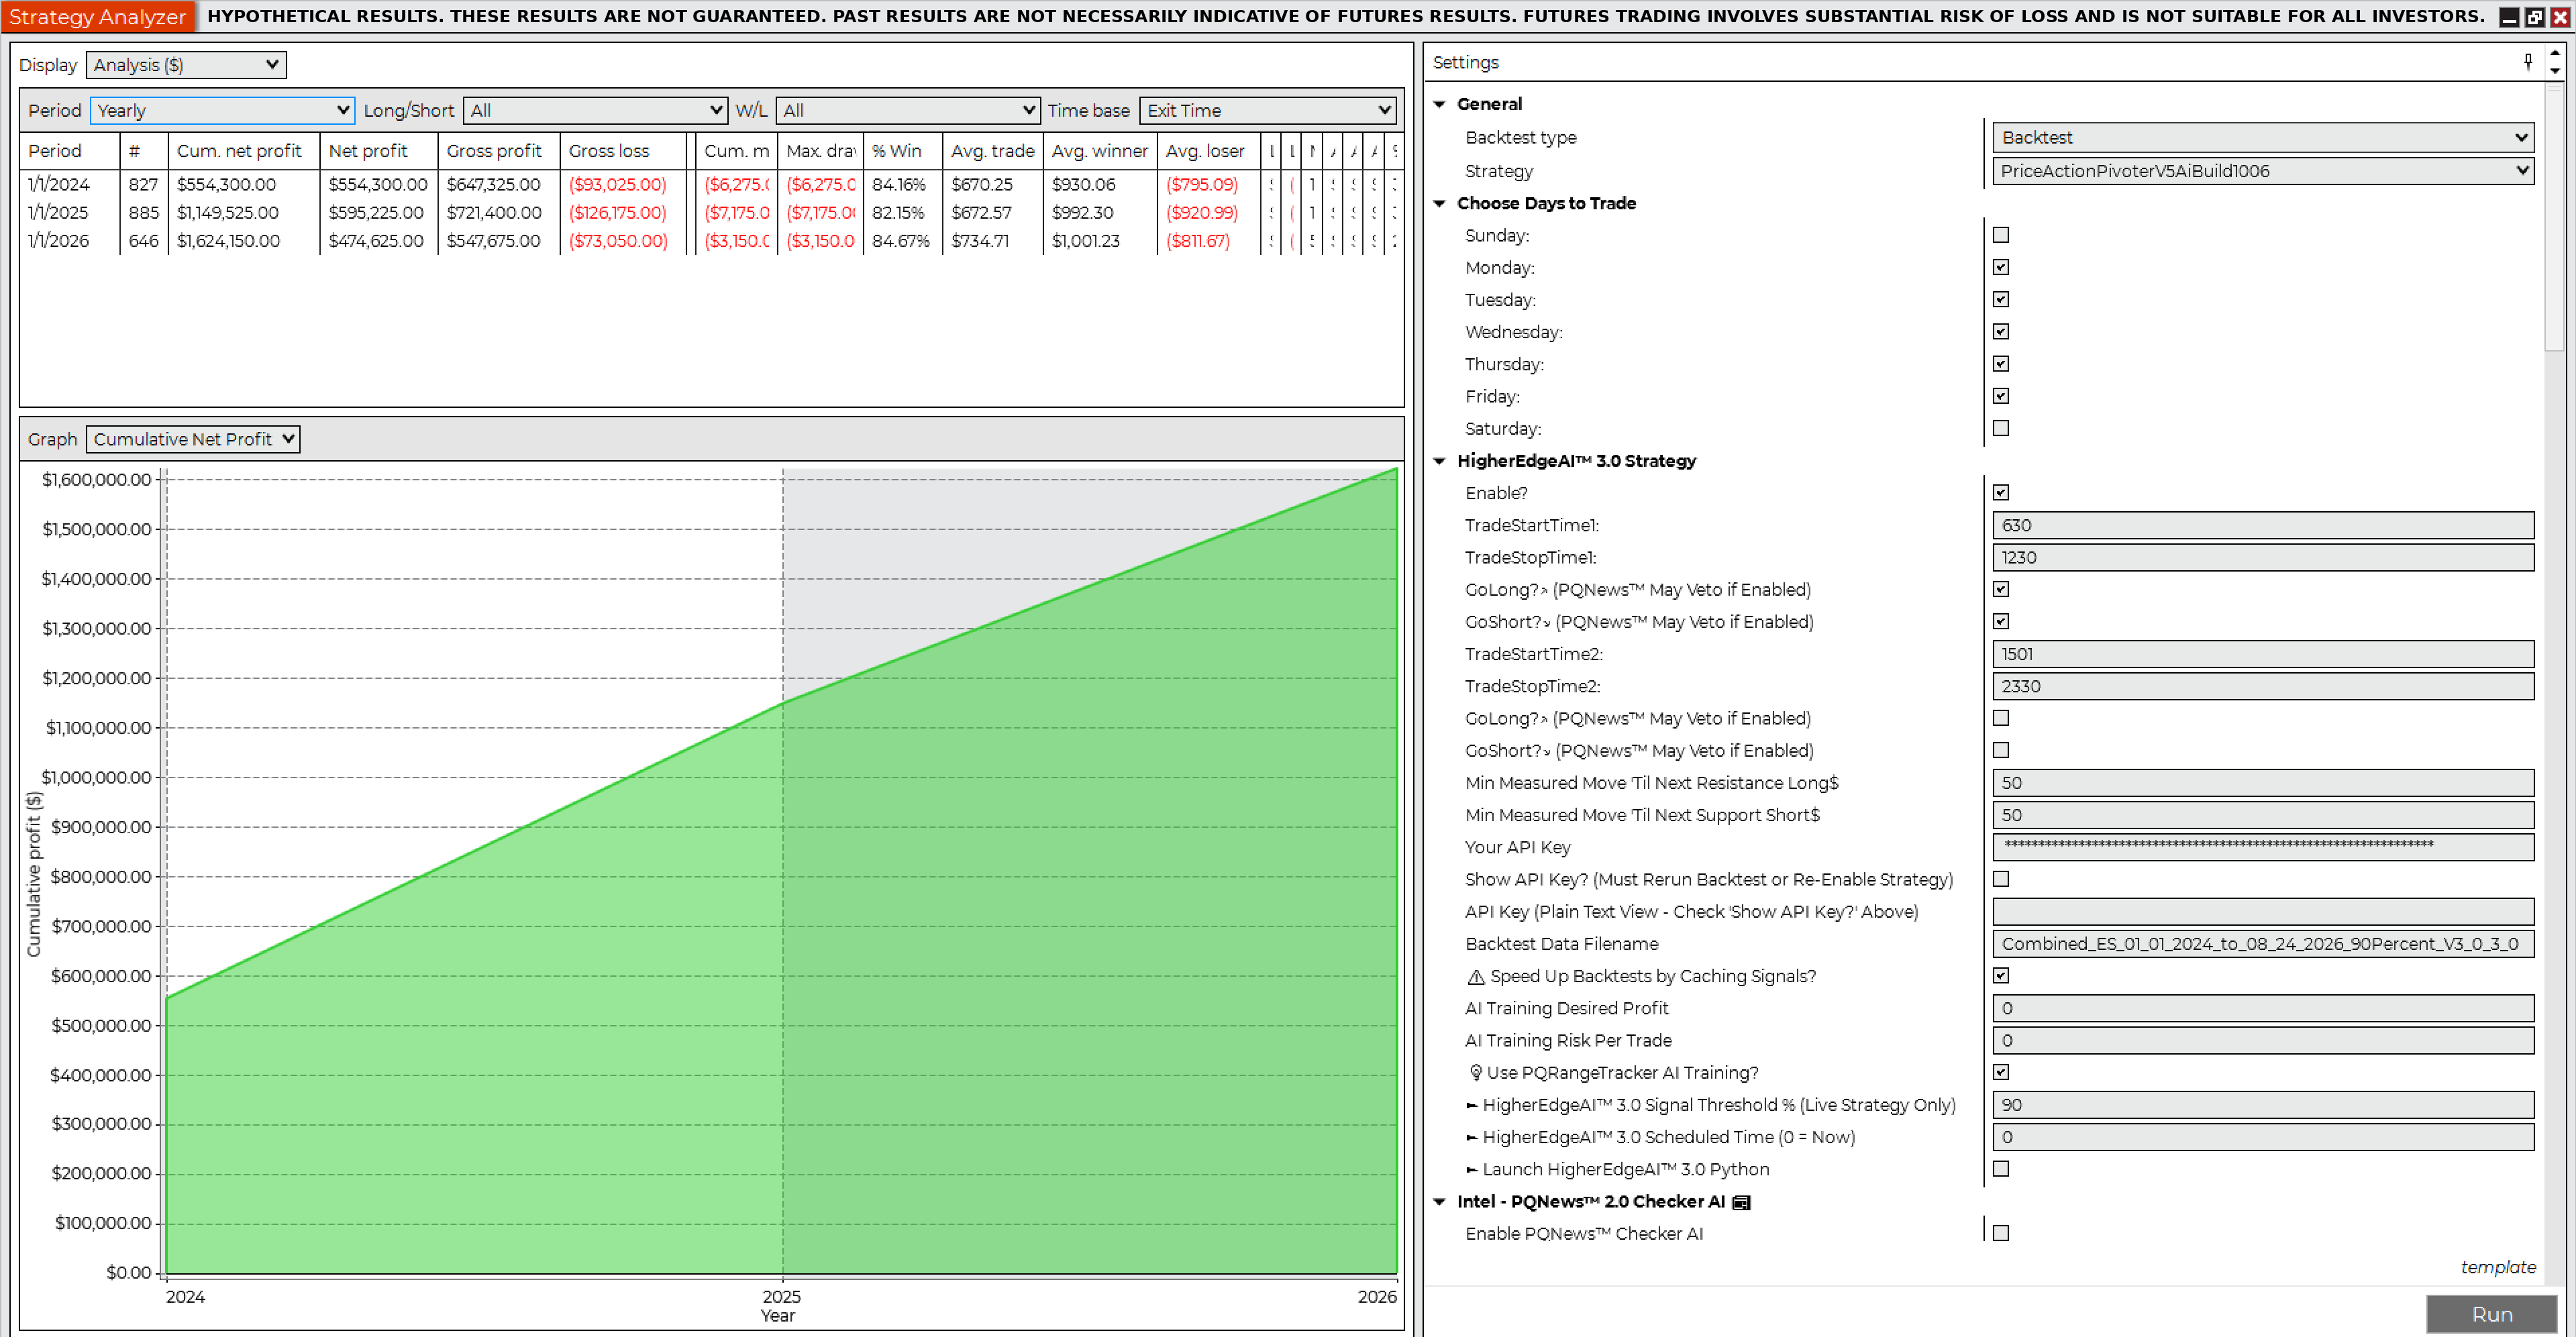
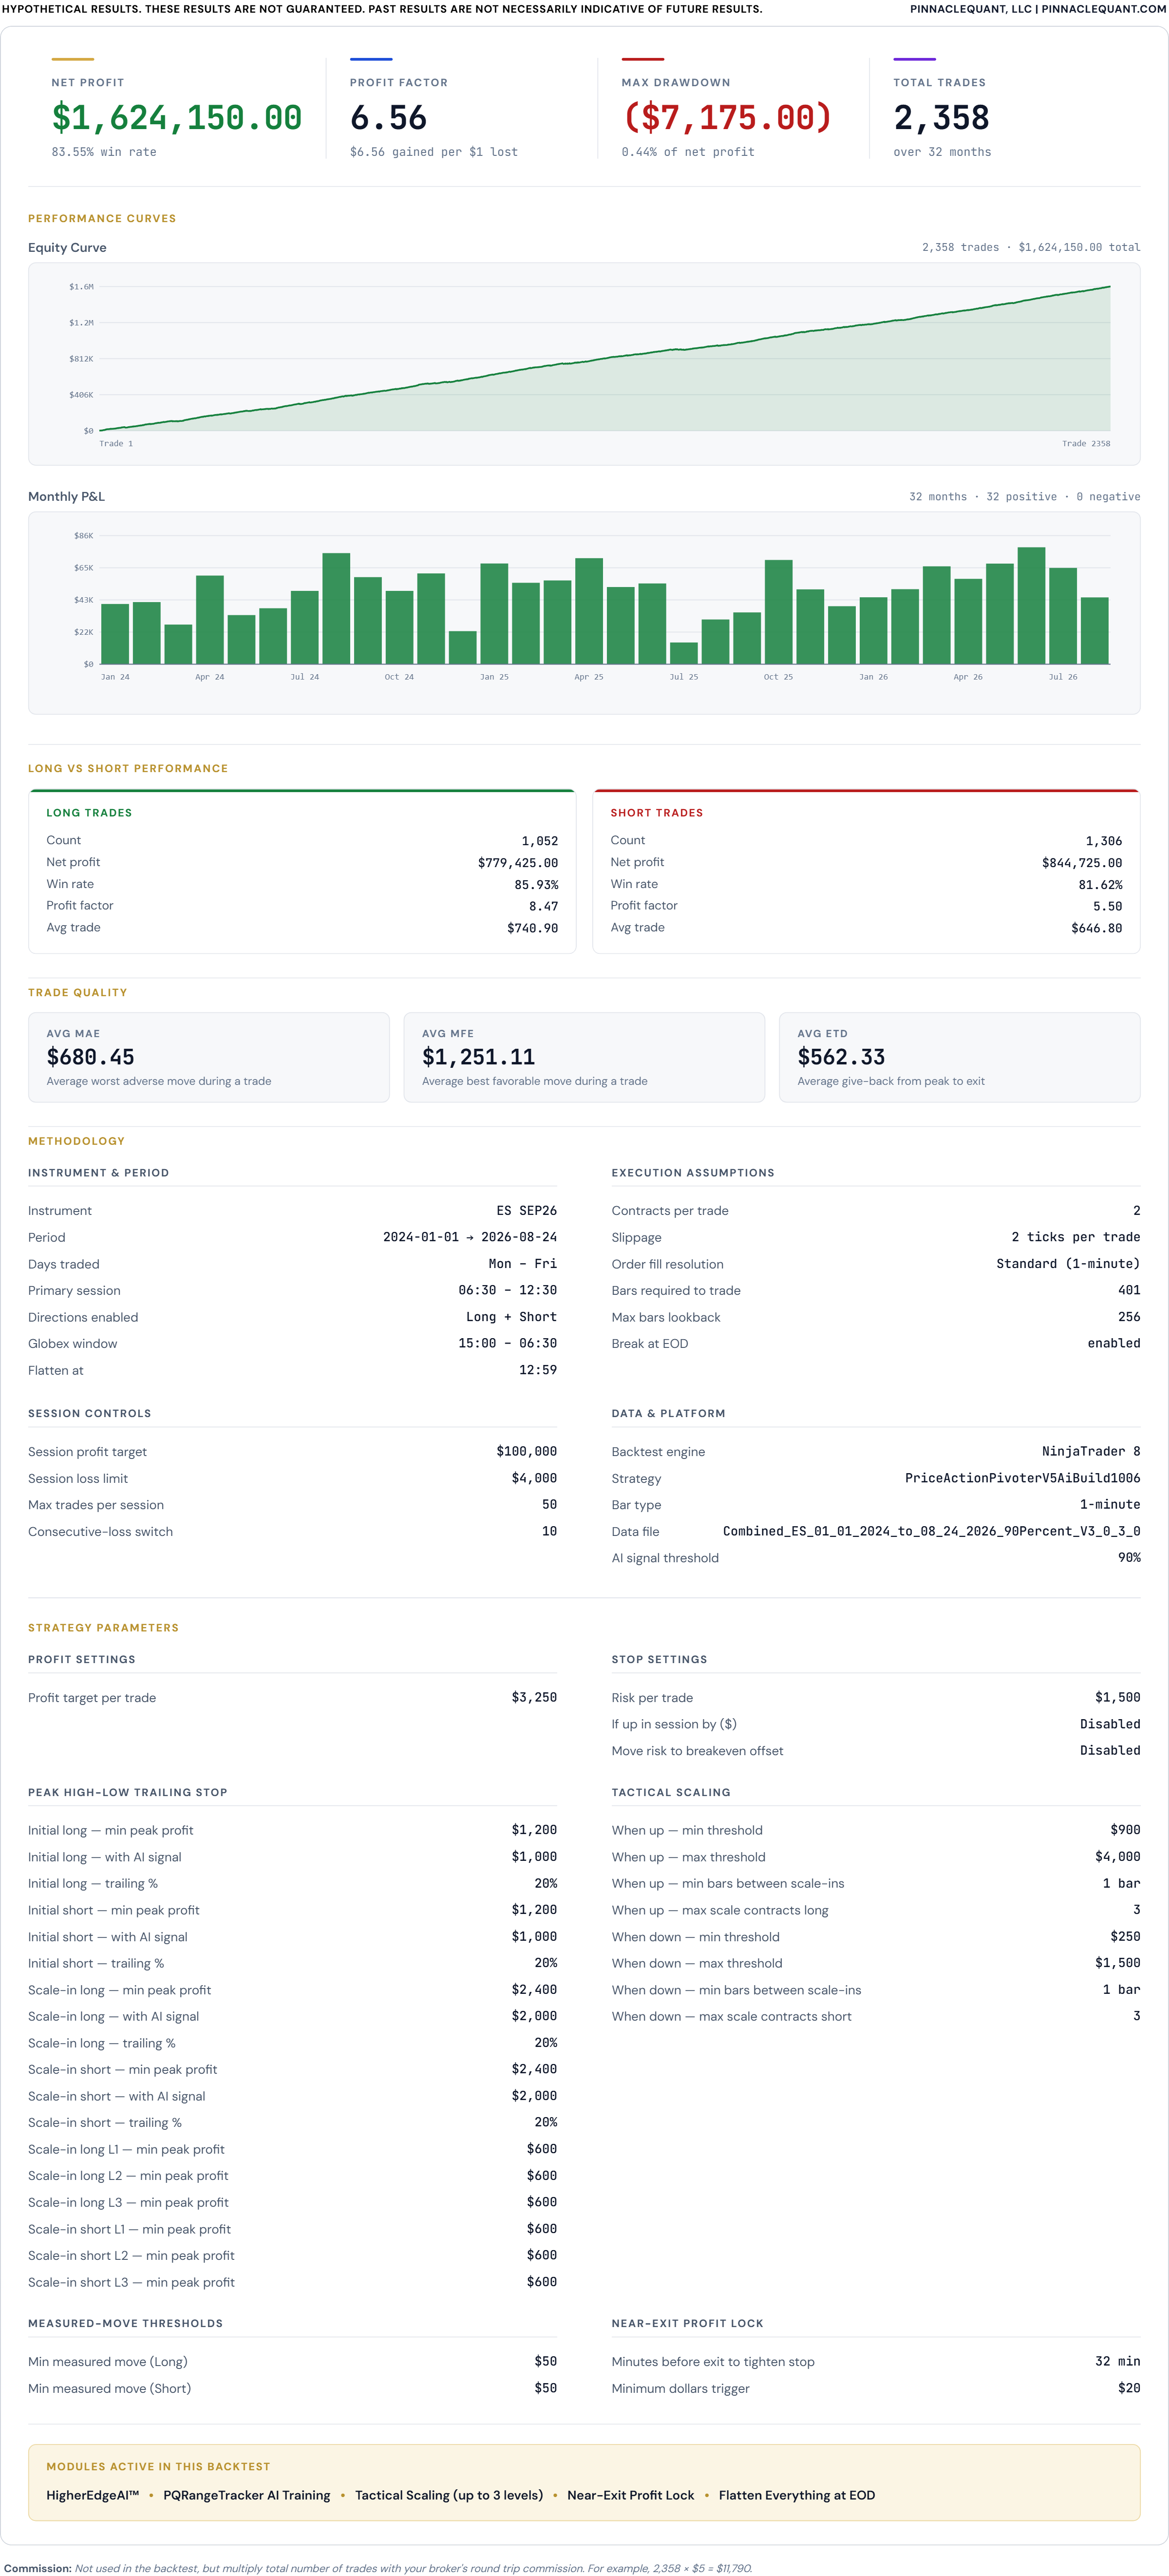
Backtest 4 · ES · 2 Contracts · 90% HigherEdgeAI™ 3.0 confidence
Net profit $1,624,150.00
Gross profit$1,916,400.00
Gross loss($292,250.00)
Profit factor6.56
Max drawdown($7,175.00)
Trades2,358
Win rate83.55%
Winning trades1,970
Losing trades344
Sharpe ratio2.12
Sortino ratio1.00
Avg time in market64.76 min
Max time to recover18.83 days
Longest flat period10.89 days
Average MAE$680.45
Average MFE$1,251.11
Contracts · slippage2 · 2 ticks
Jan 1, 2024 – Aug 24, 2026 · RTH 6:30 AM – 12:30 PM Pacific, flat by 12:59 PM · all market conditions including economic news events · commissions excluded (example: $10 × 2,358 = $23,580 round-trip).
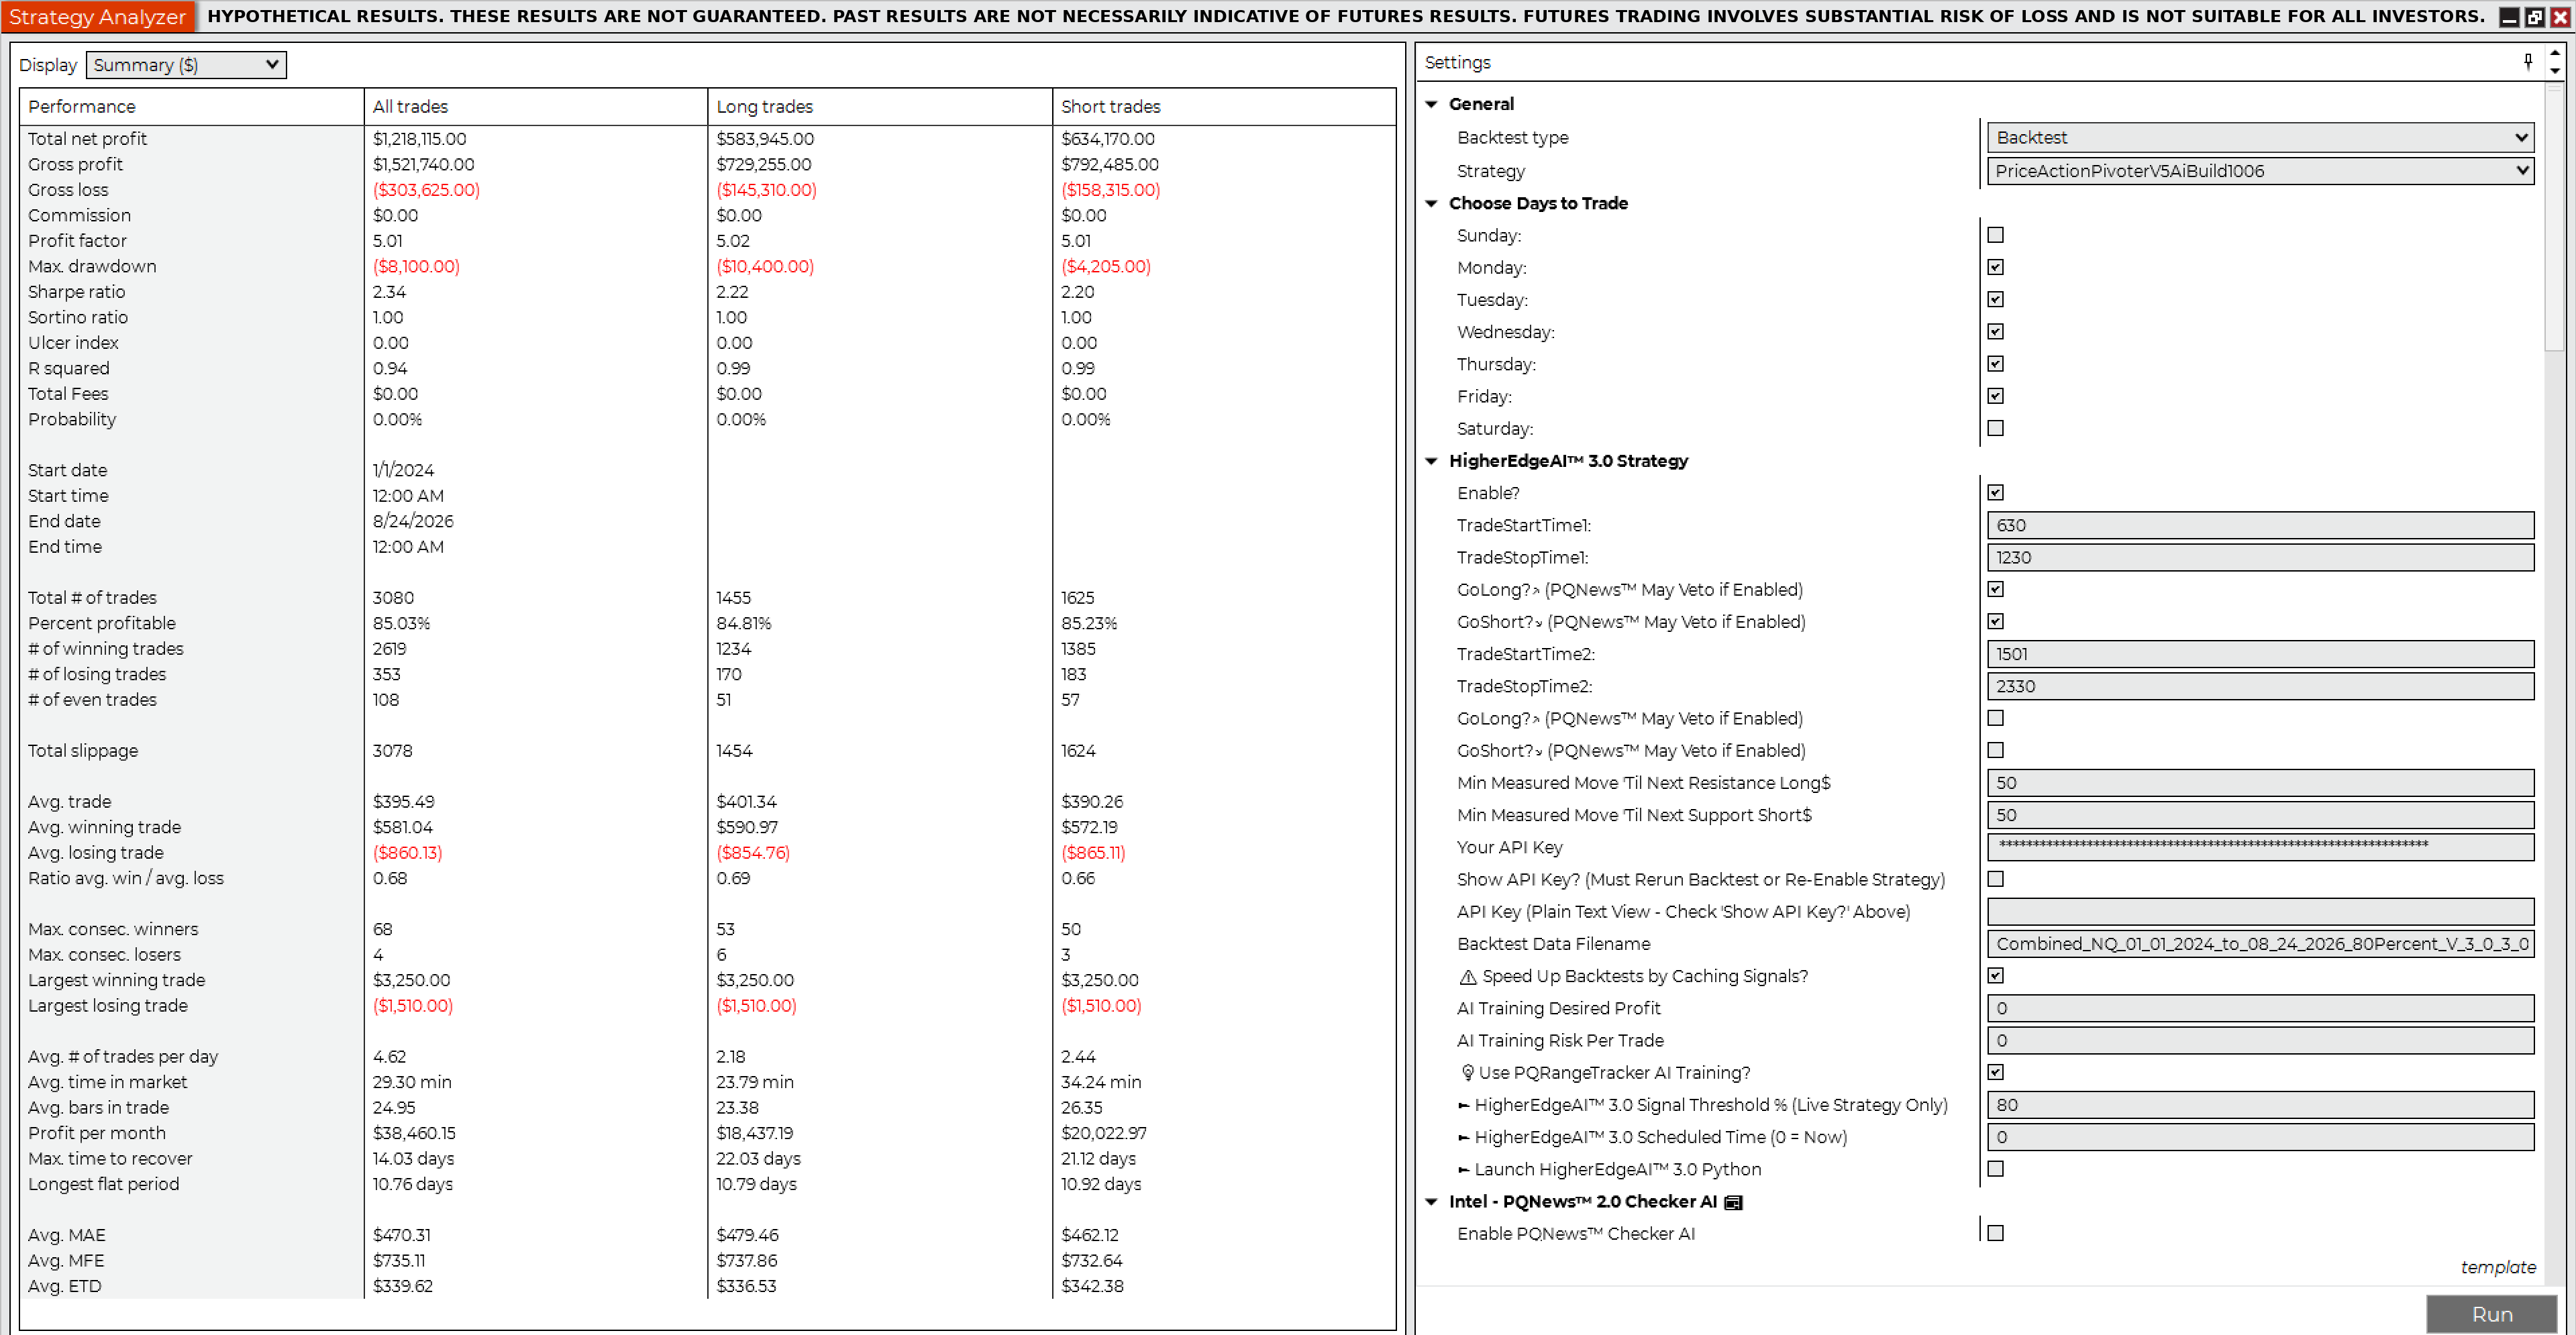
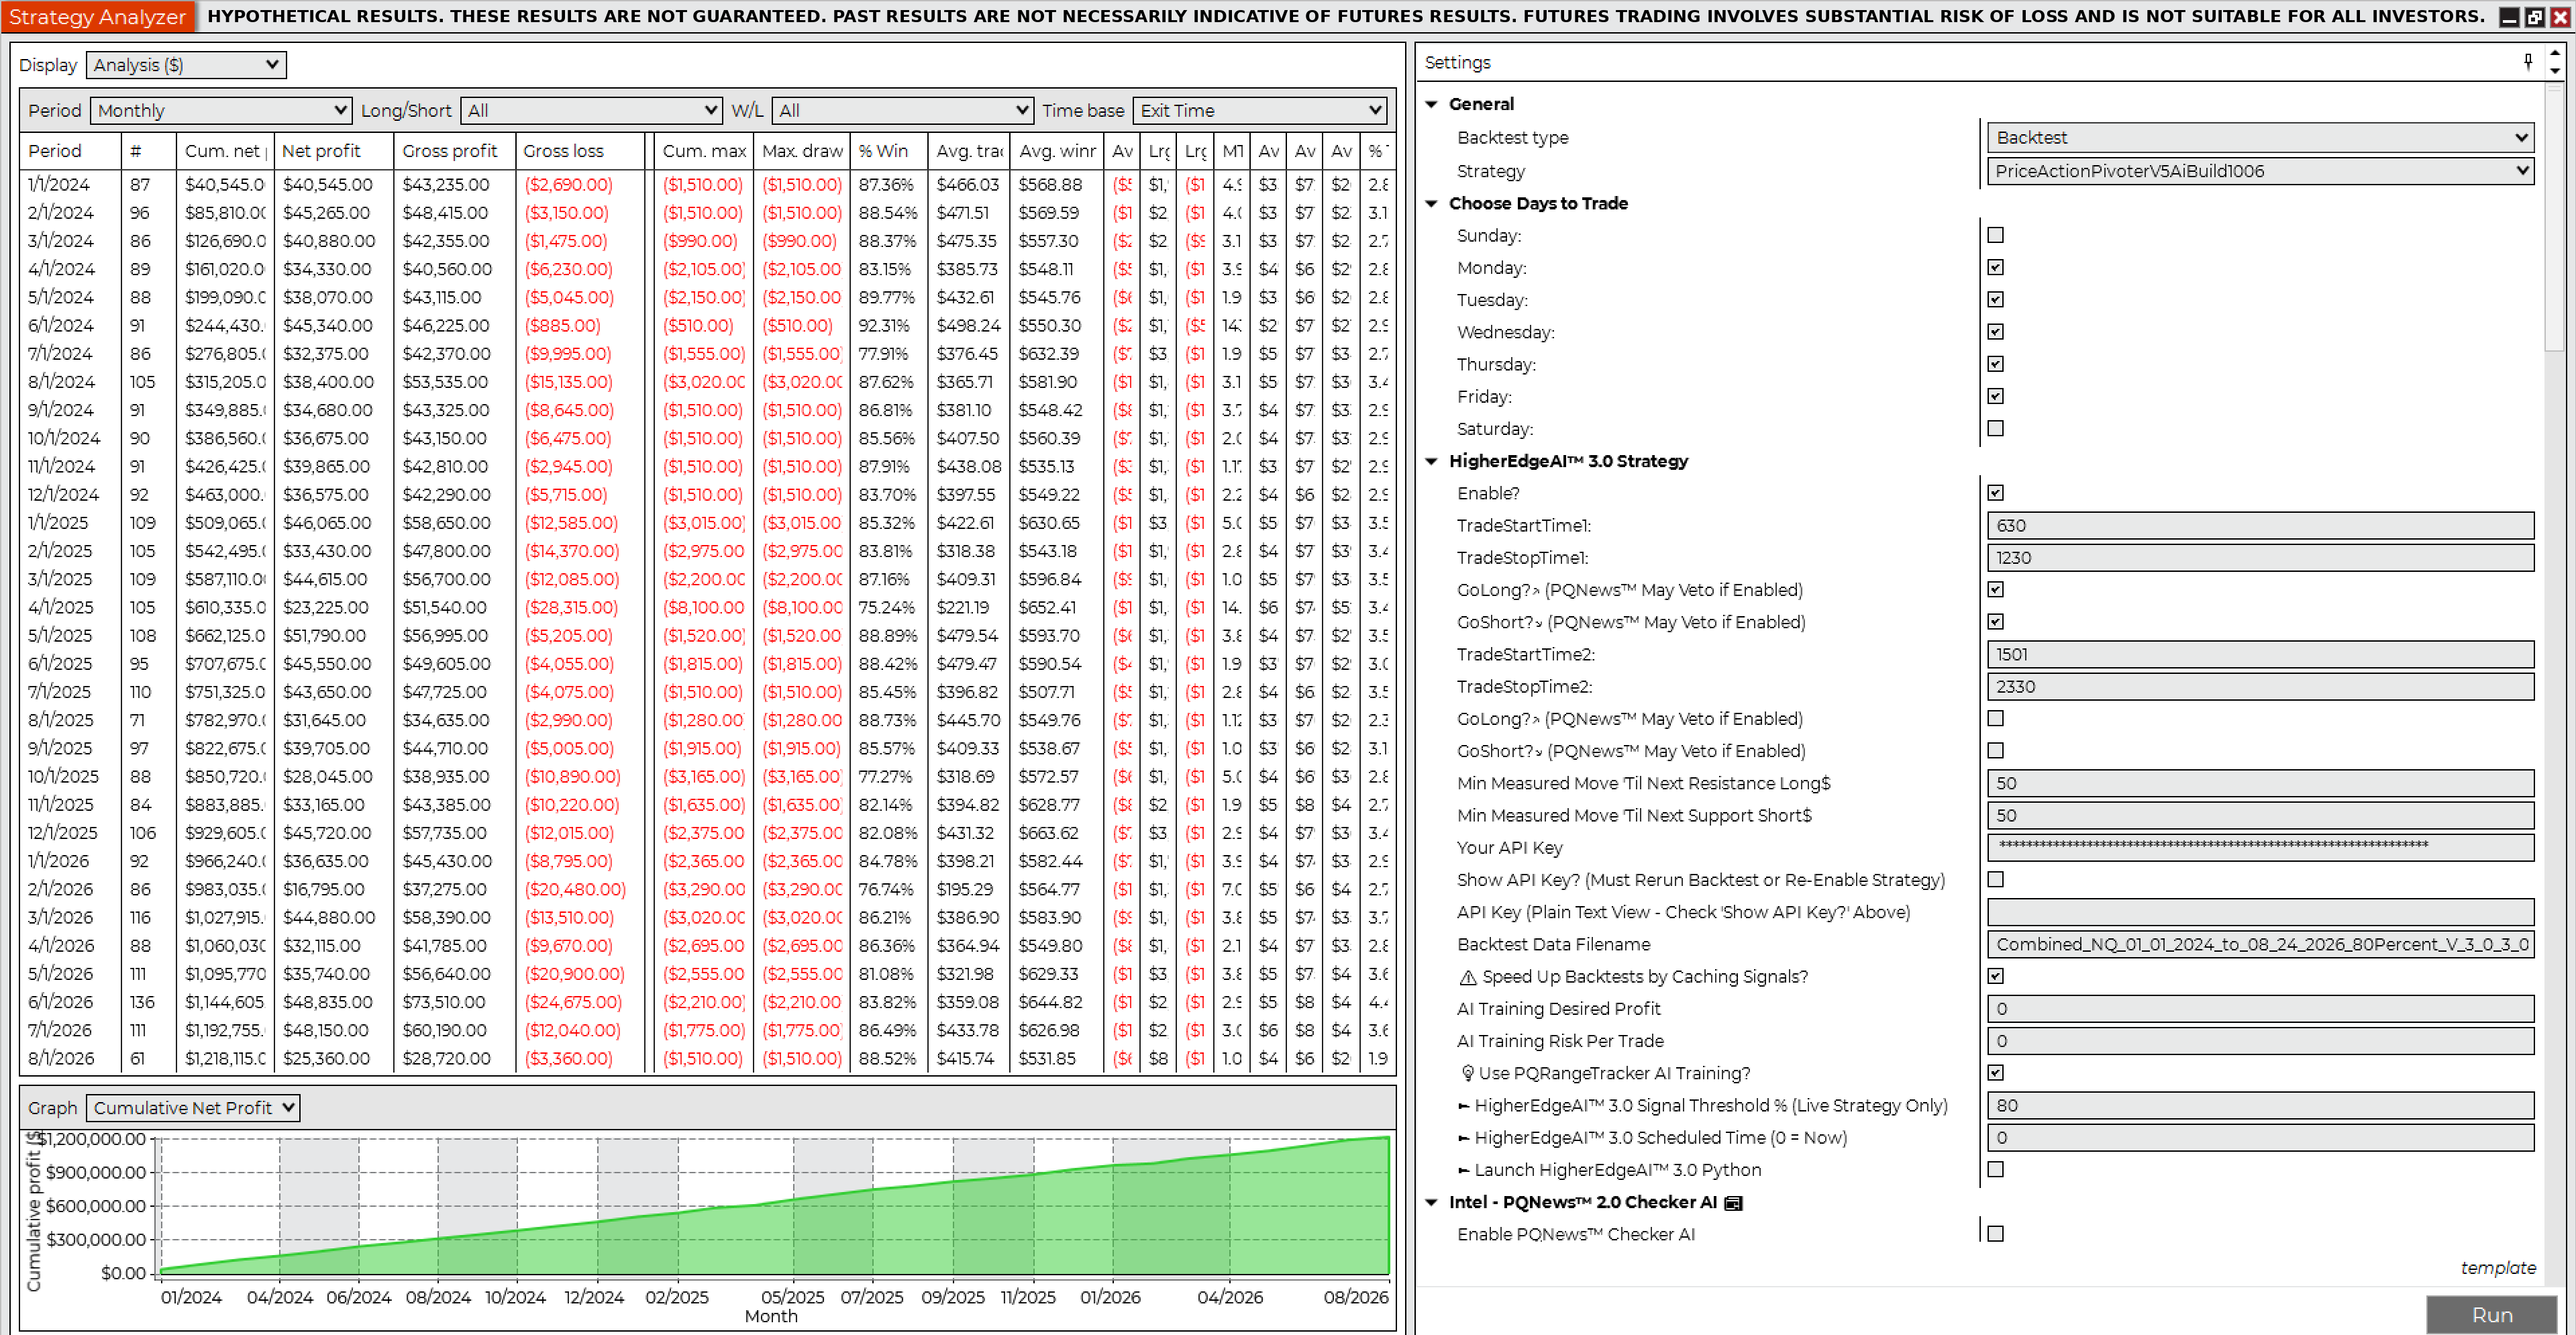
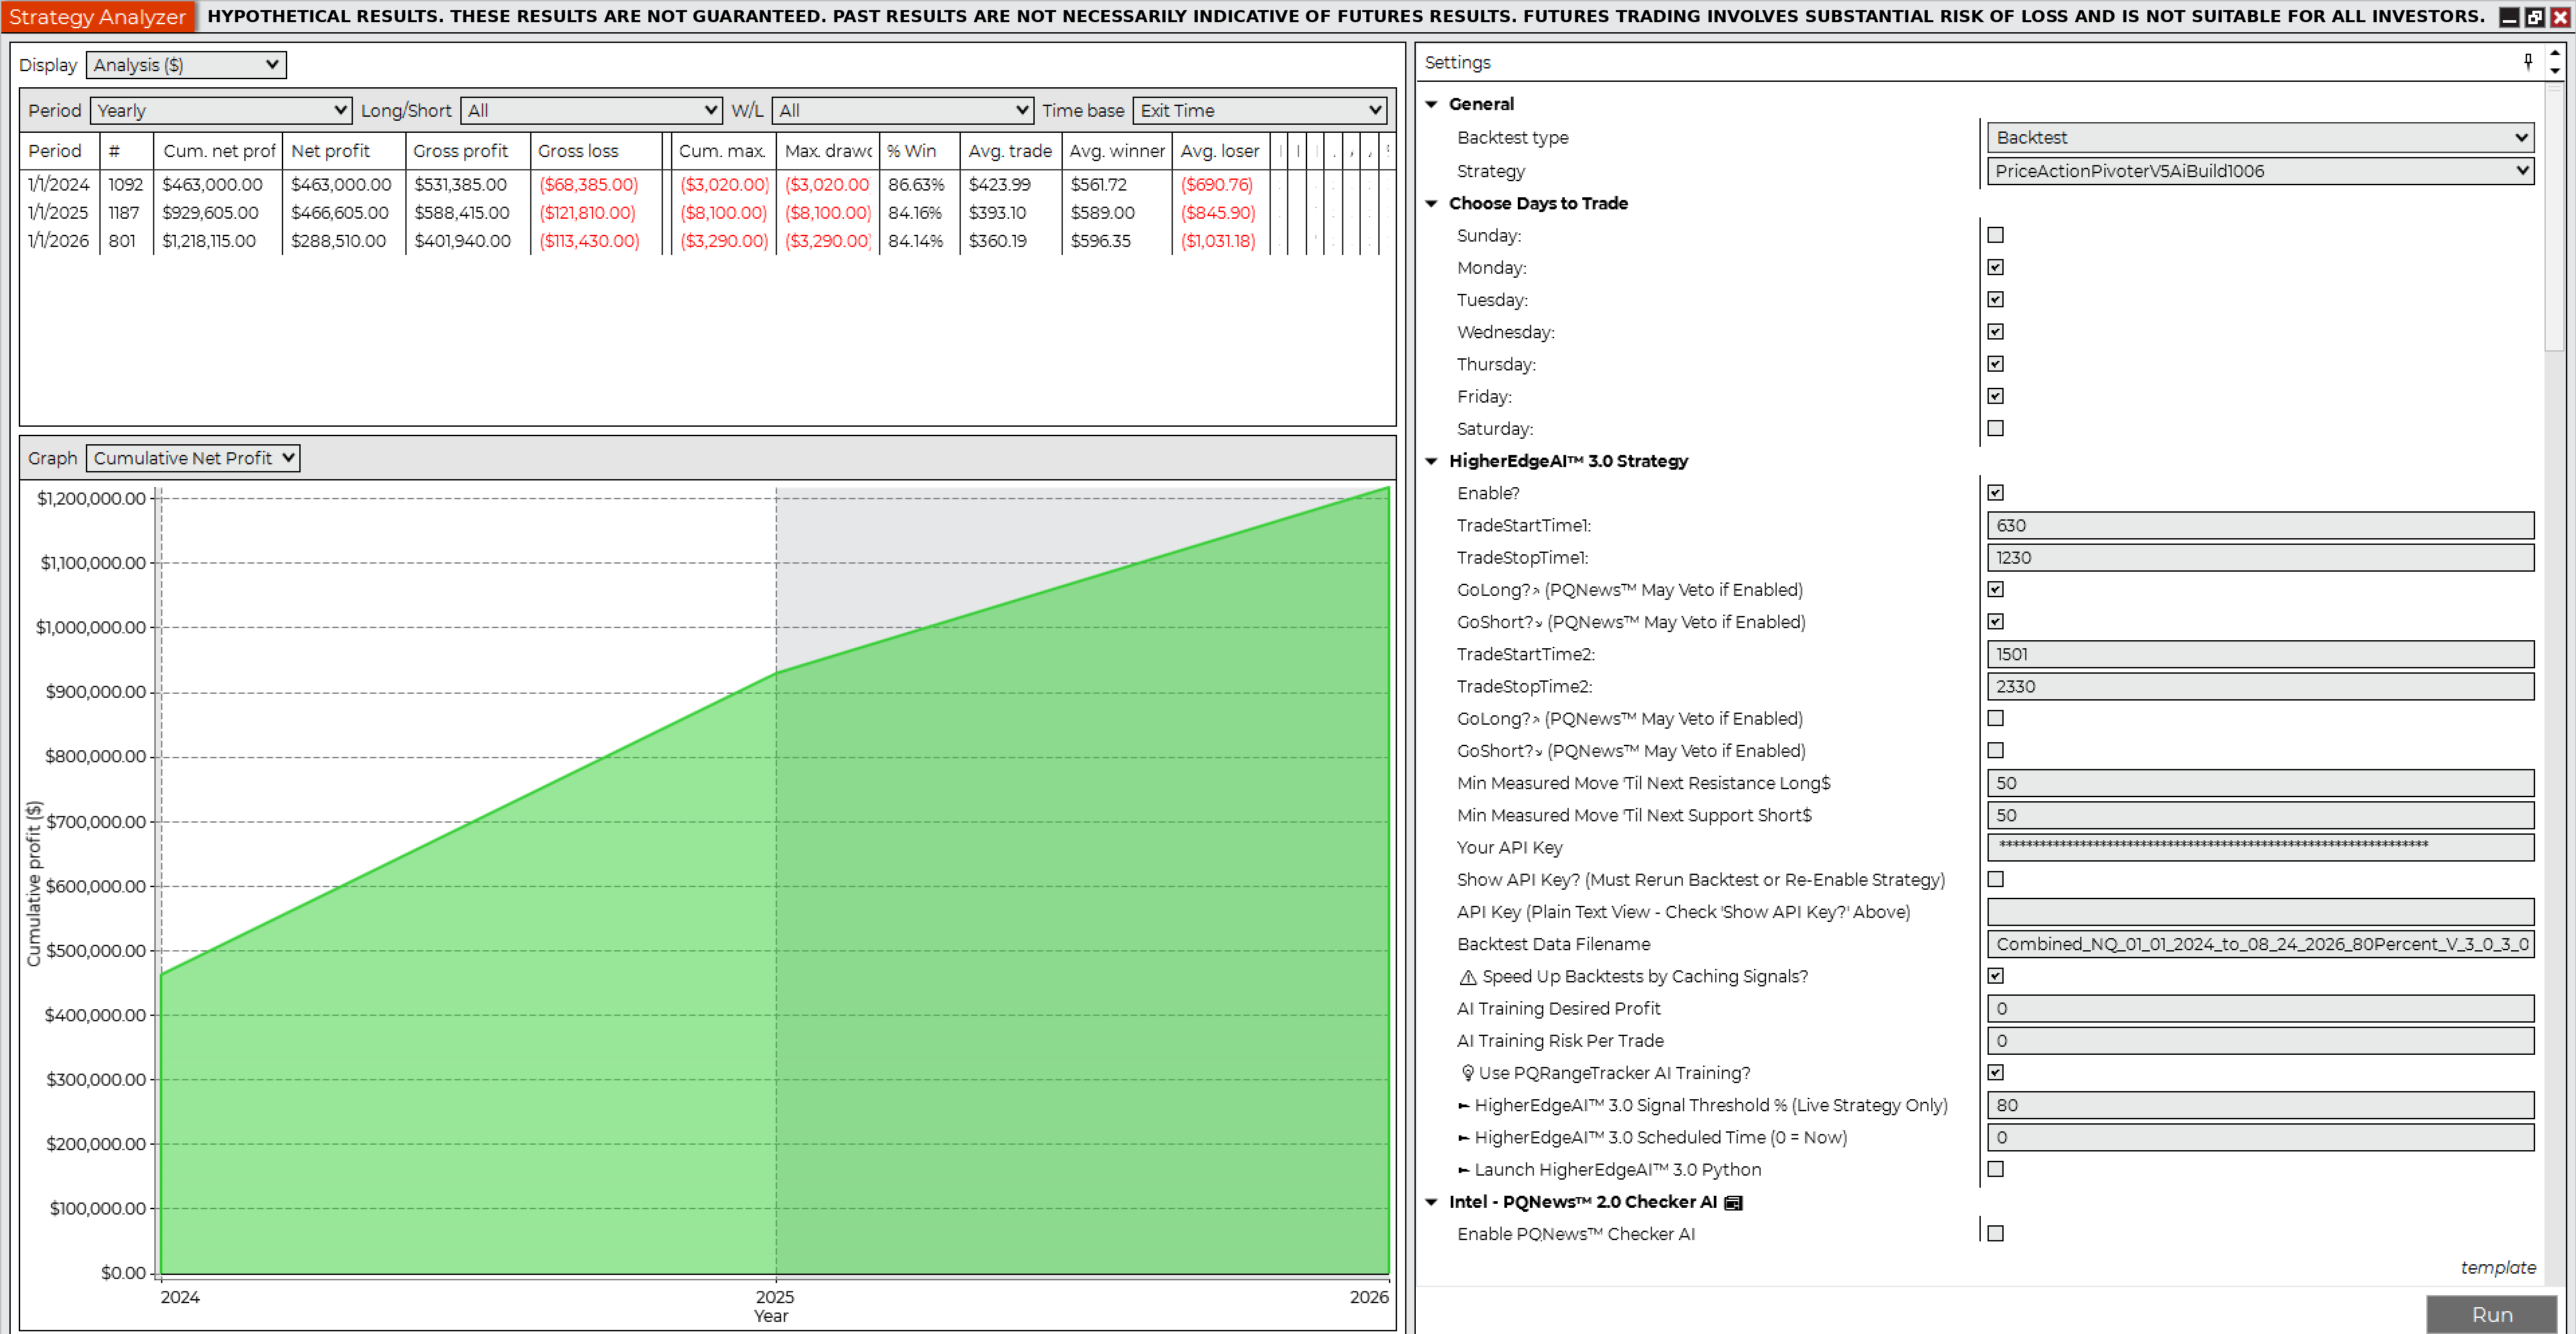
Backtest 5 · NQ · 1 Contract · 80% HigherEdgeAI™ 3.0 confidence
Net profit $1,218,115.00
Gross profit$1,521,740.00
Gross loss($303,625.00)
Profit factor5.01
Max drawdown($8,100.00)
Trades3,080
Win rate85.03%
Winning trades2,619
Losing trades353
Sharpe ratio2.34
Sortino ratio1.00
Avg time in market29.30 min
Max time to recover14.03 days
Longest flat period10.76 days
Average MAE$470.31
Average MFE$735.11
Contracts · slippage1 · 2 ticks
Jan 1, 2024 – Aug 24, 2026 · RTH 6:30 AM – 12:30 PM Pacific, flat by 12:59 PM · all market conditions including economic news events · commissions excluded (example: $5 × 3,080 = $15,400 round-trip).
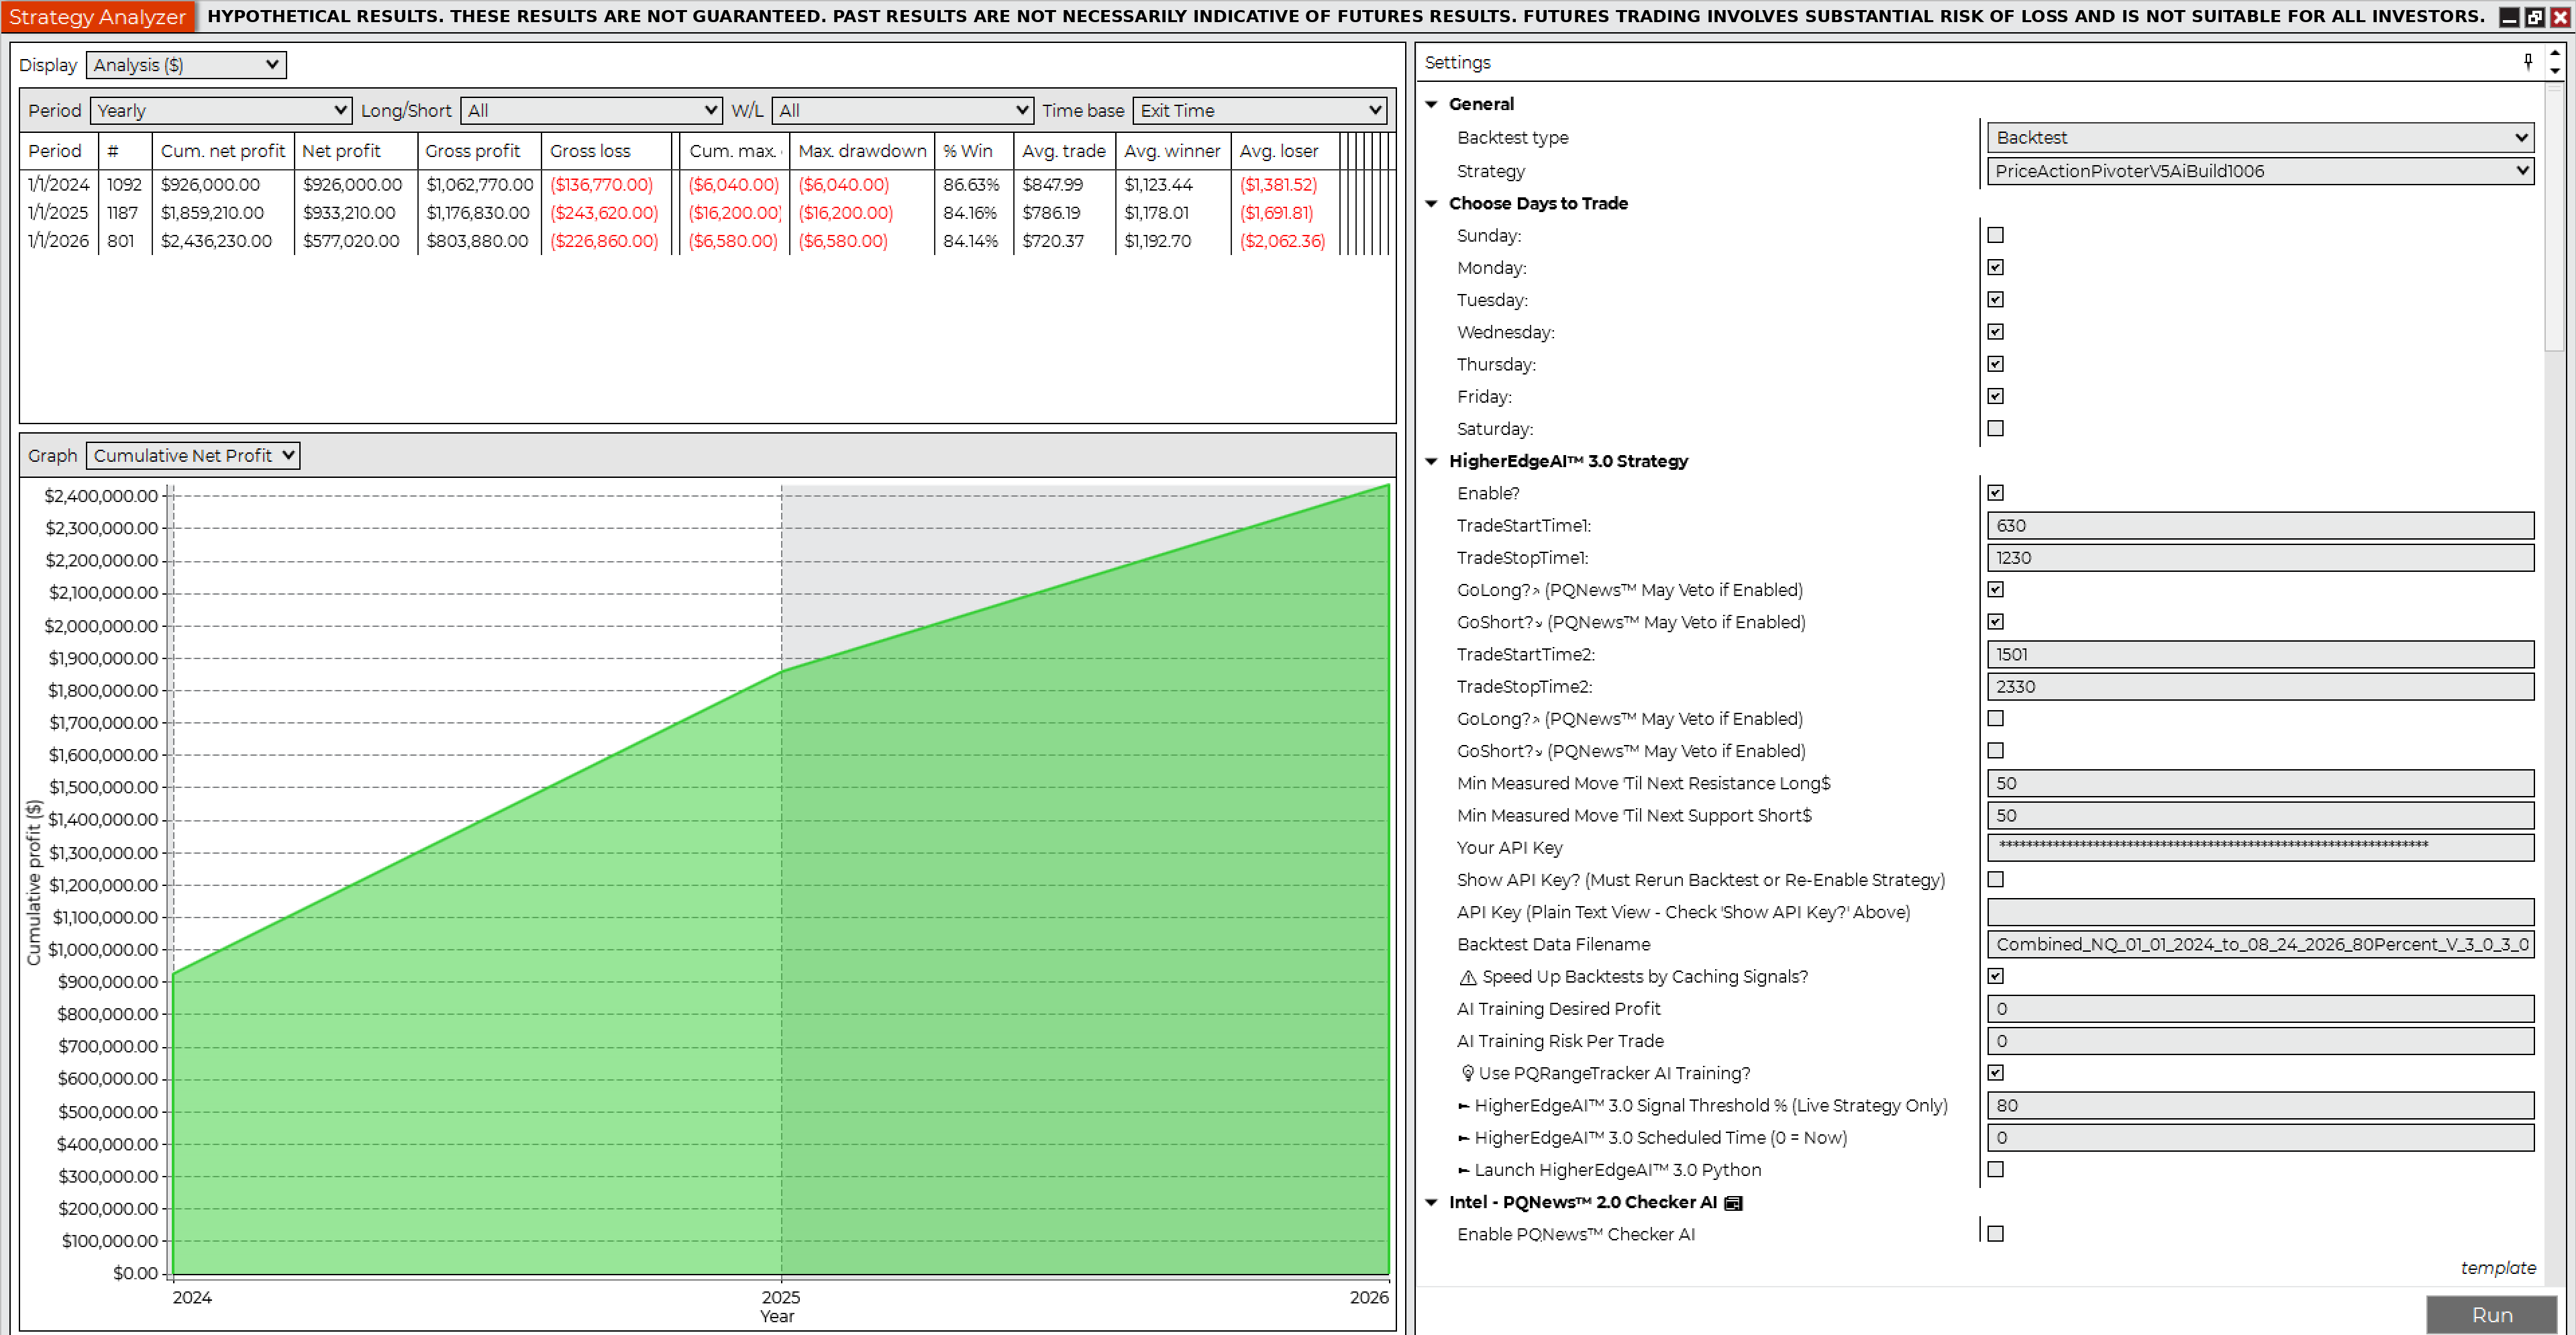
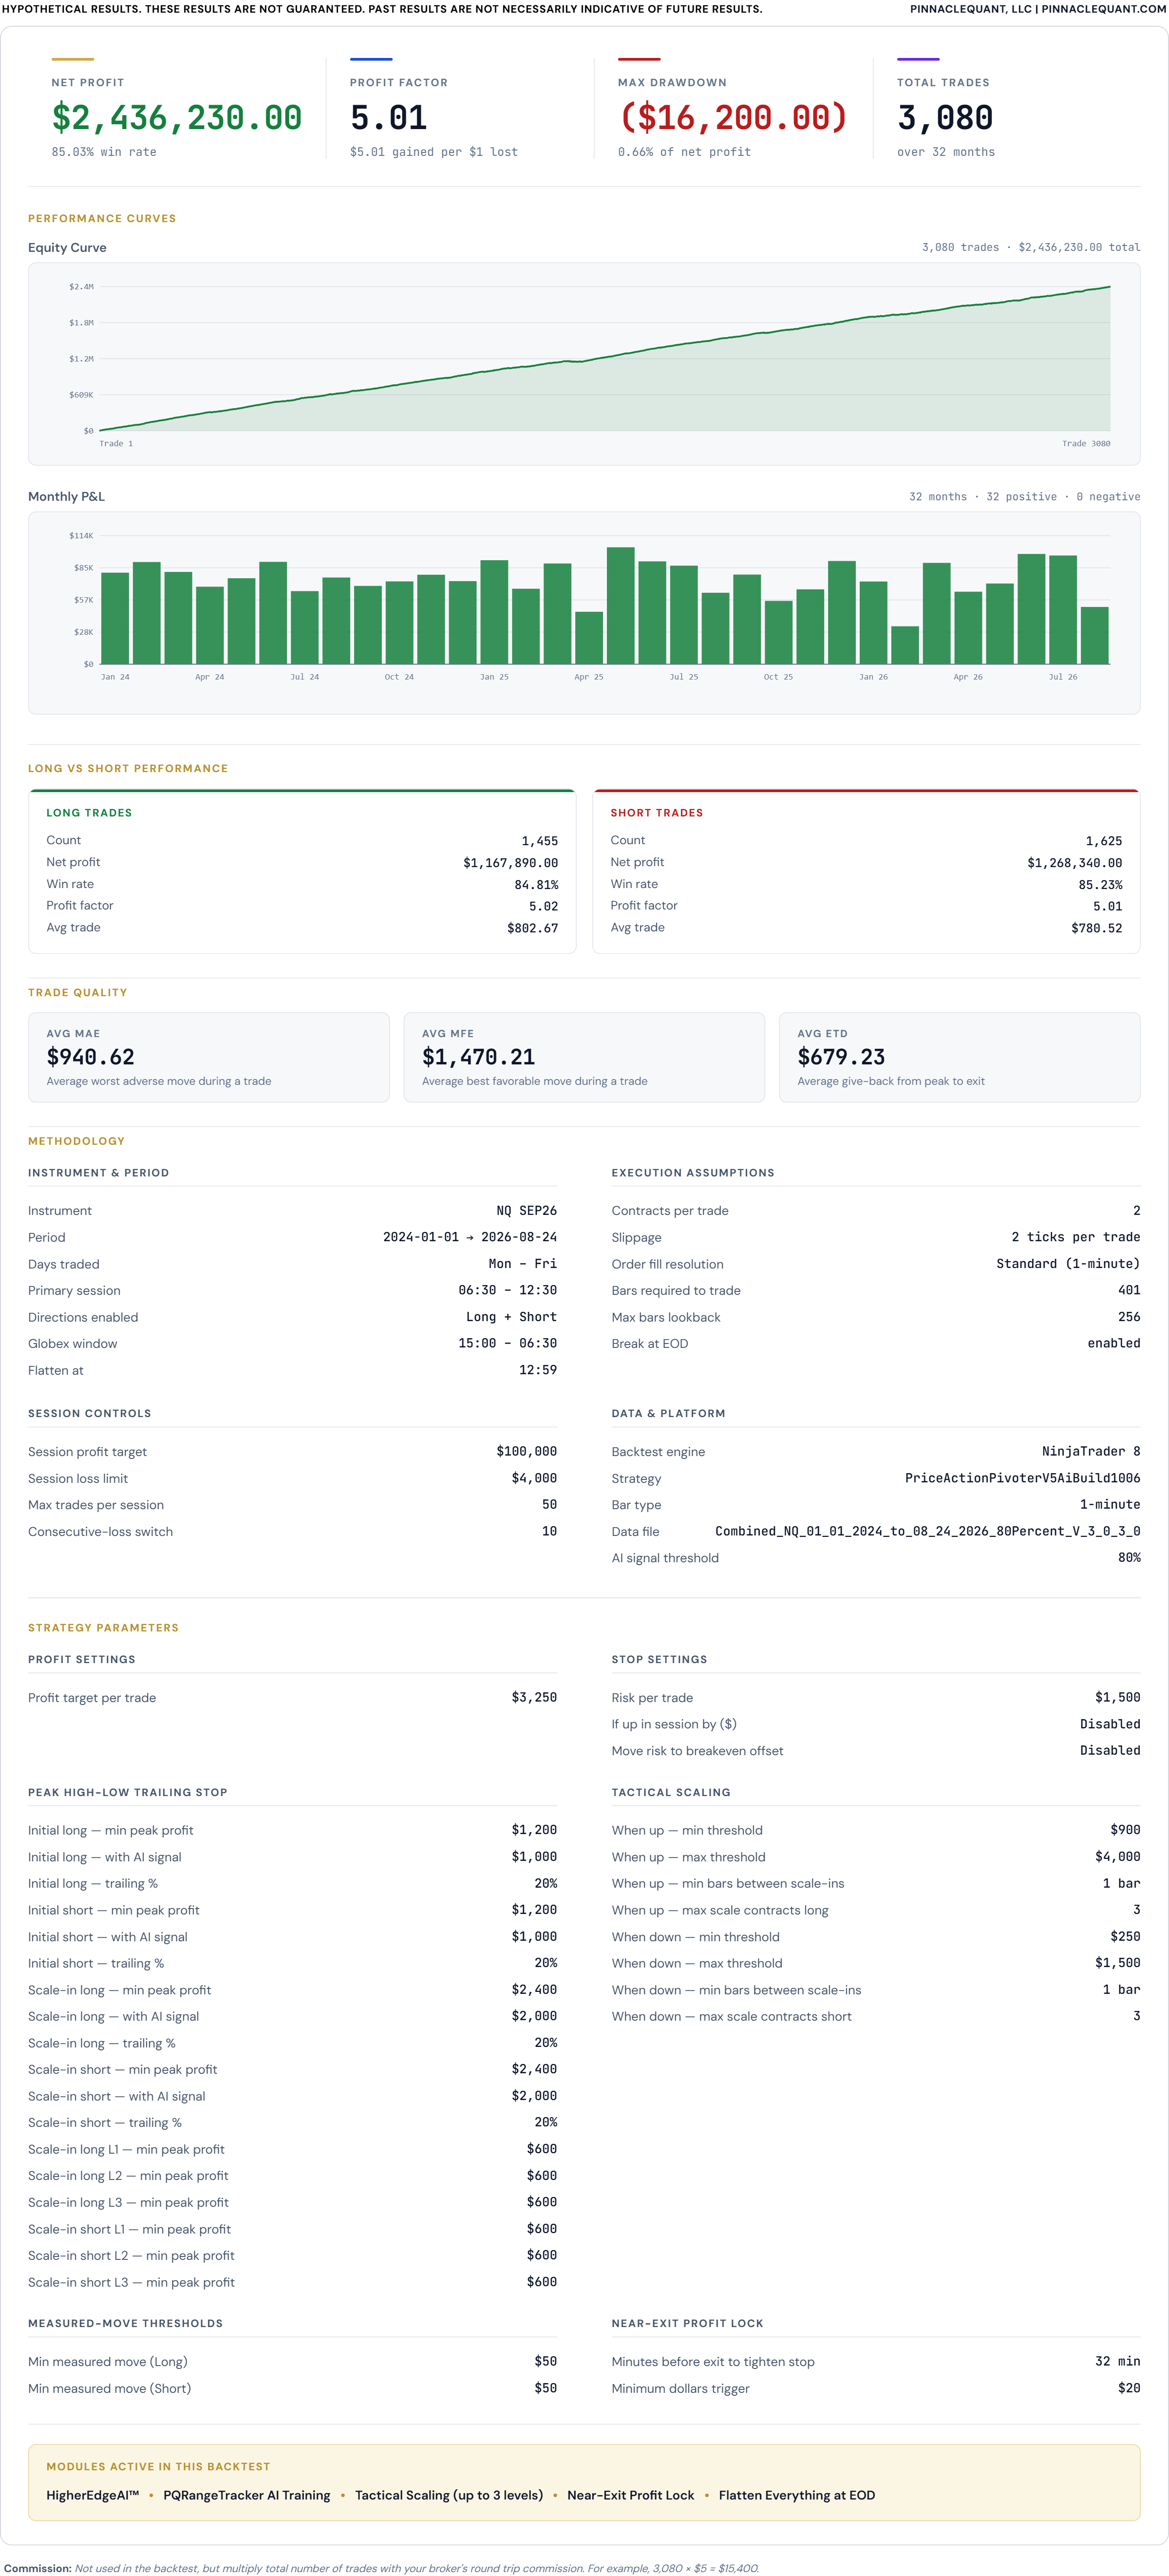
Backtest 6 · NQ · 2 Contracts · 80% HigherEdgeAI™ 3.0 confidence
Net profit $2,436,230.00
Gross profit$3,043,480.00
Gross loss($607,250.00)
Profit factor5.01
Max drawdown($16,200.00)
Trades3,080
Win rate85.03%
Winning trades2,619
Losing trades353
Sharpe ratio2.34
Sortino ratio1.00
Avg time in market29.30 min
Max time to recover14.03 days
Longest flat period10.76 days
Average MAE$940.62
Average MFE$1,470.21
Contracts · slippage2 · 2 ticks
Jan 1, 2024 – Aug 24, 2026 · RTH 6:30 AM – 12:30 PM Pacific, flat by 12:59 PM · all market conditions including economic news events · commissions excluded (example: $10 × 3,080 = $30,800 round-trip).
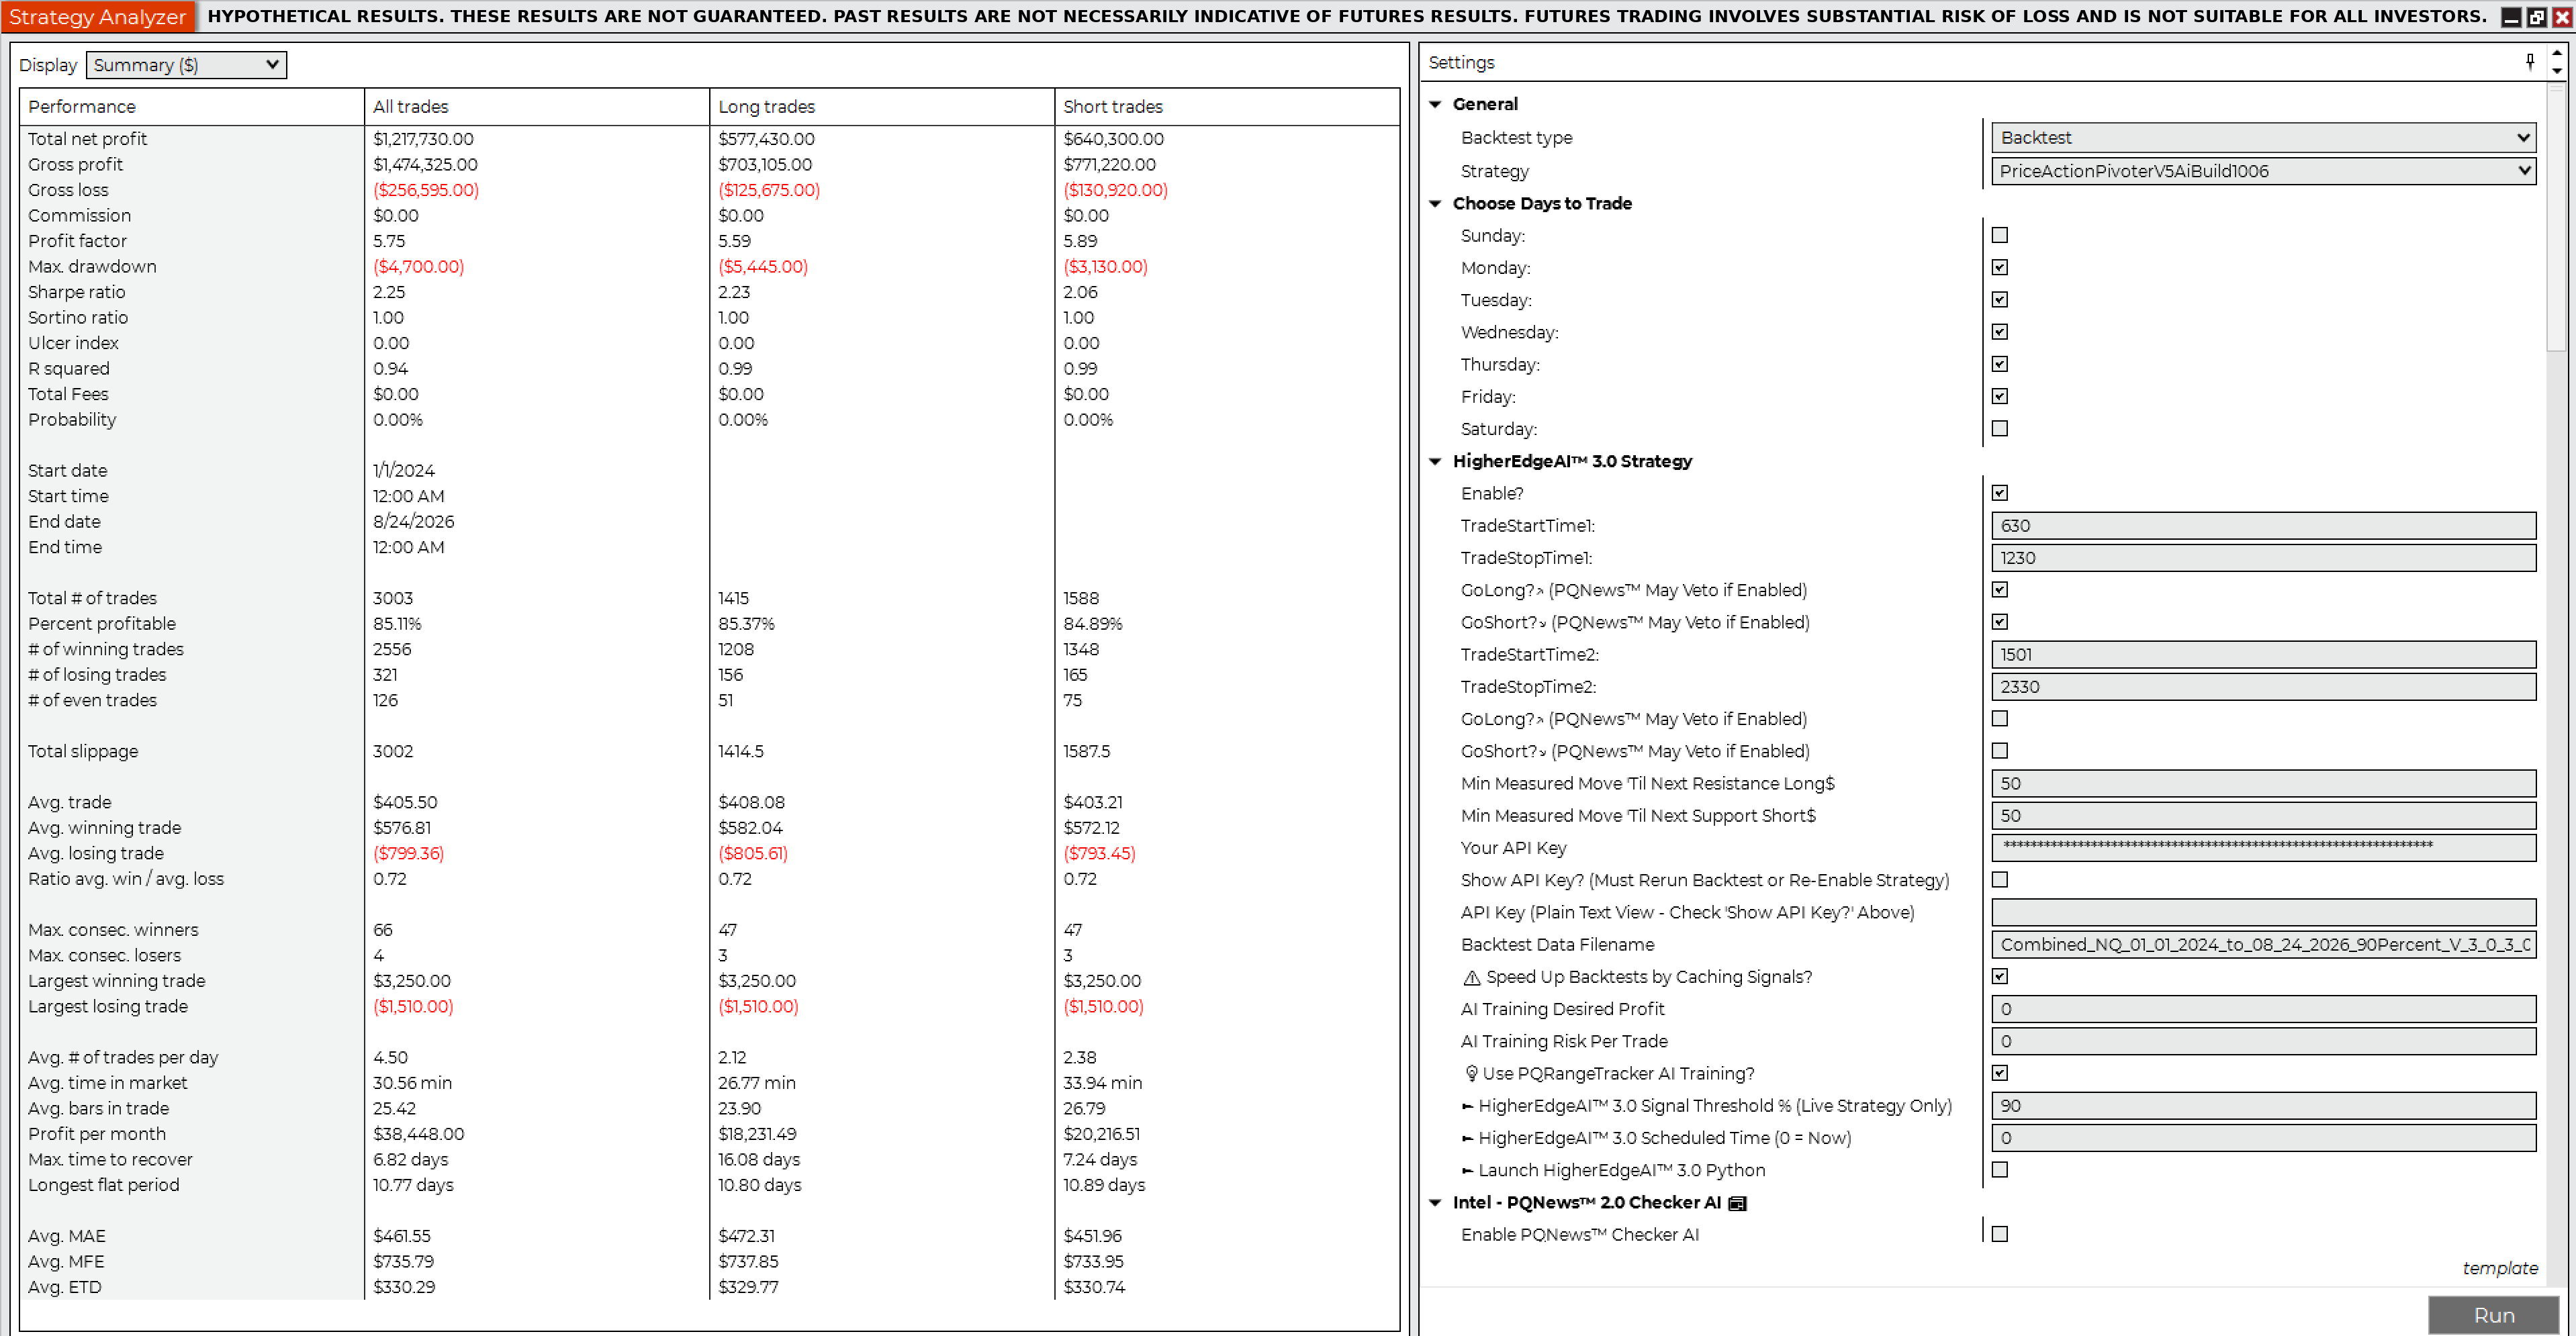
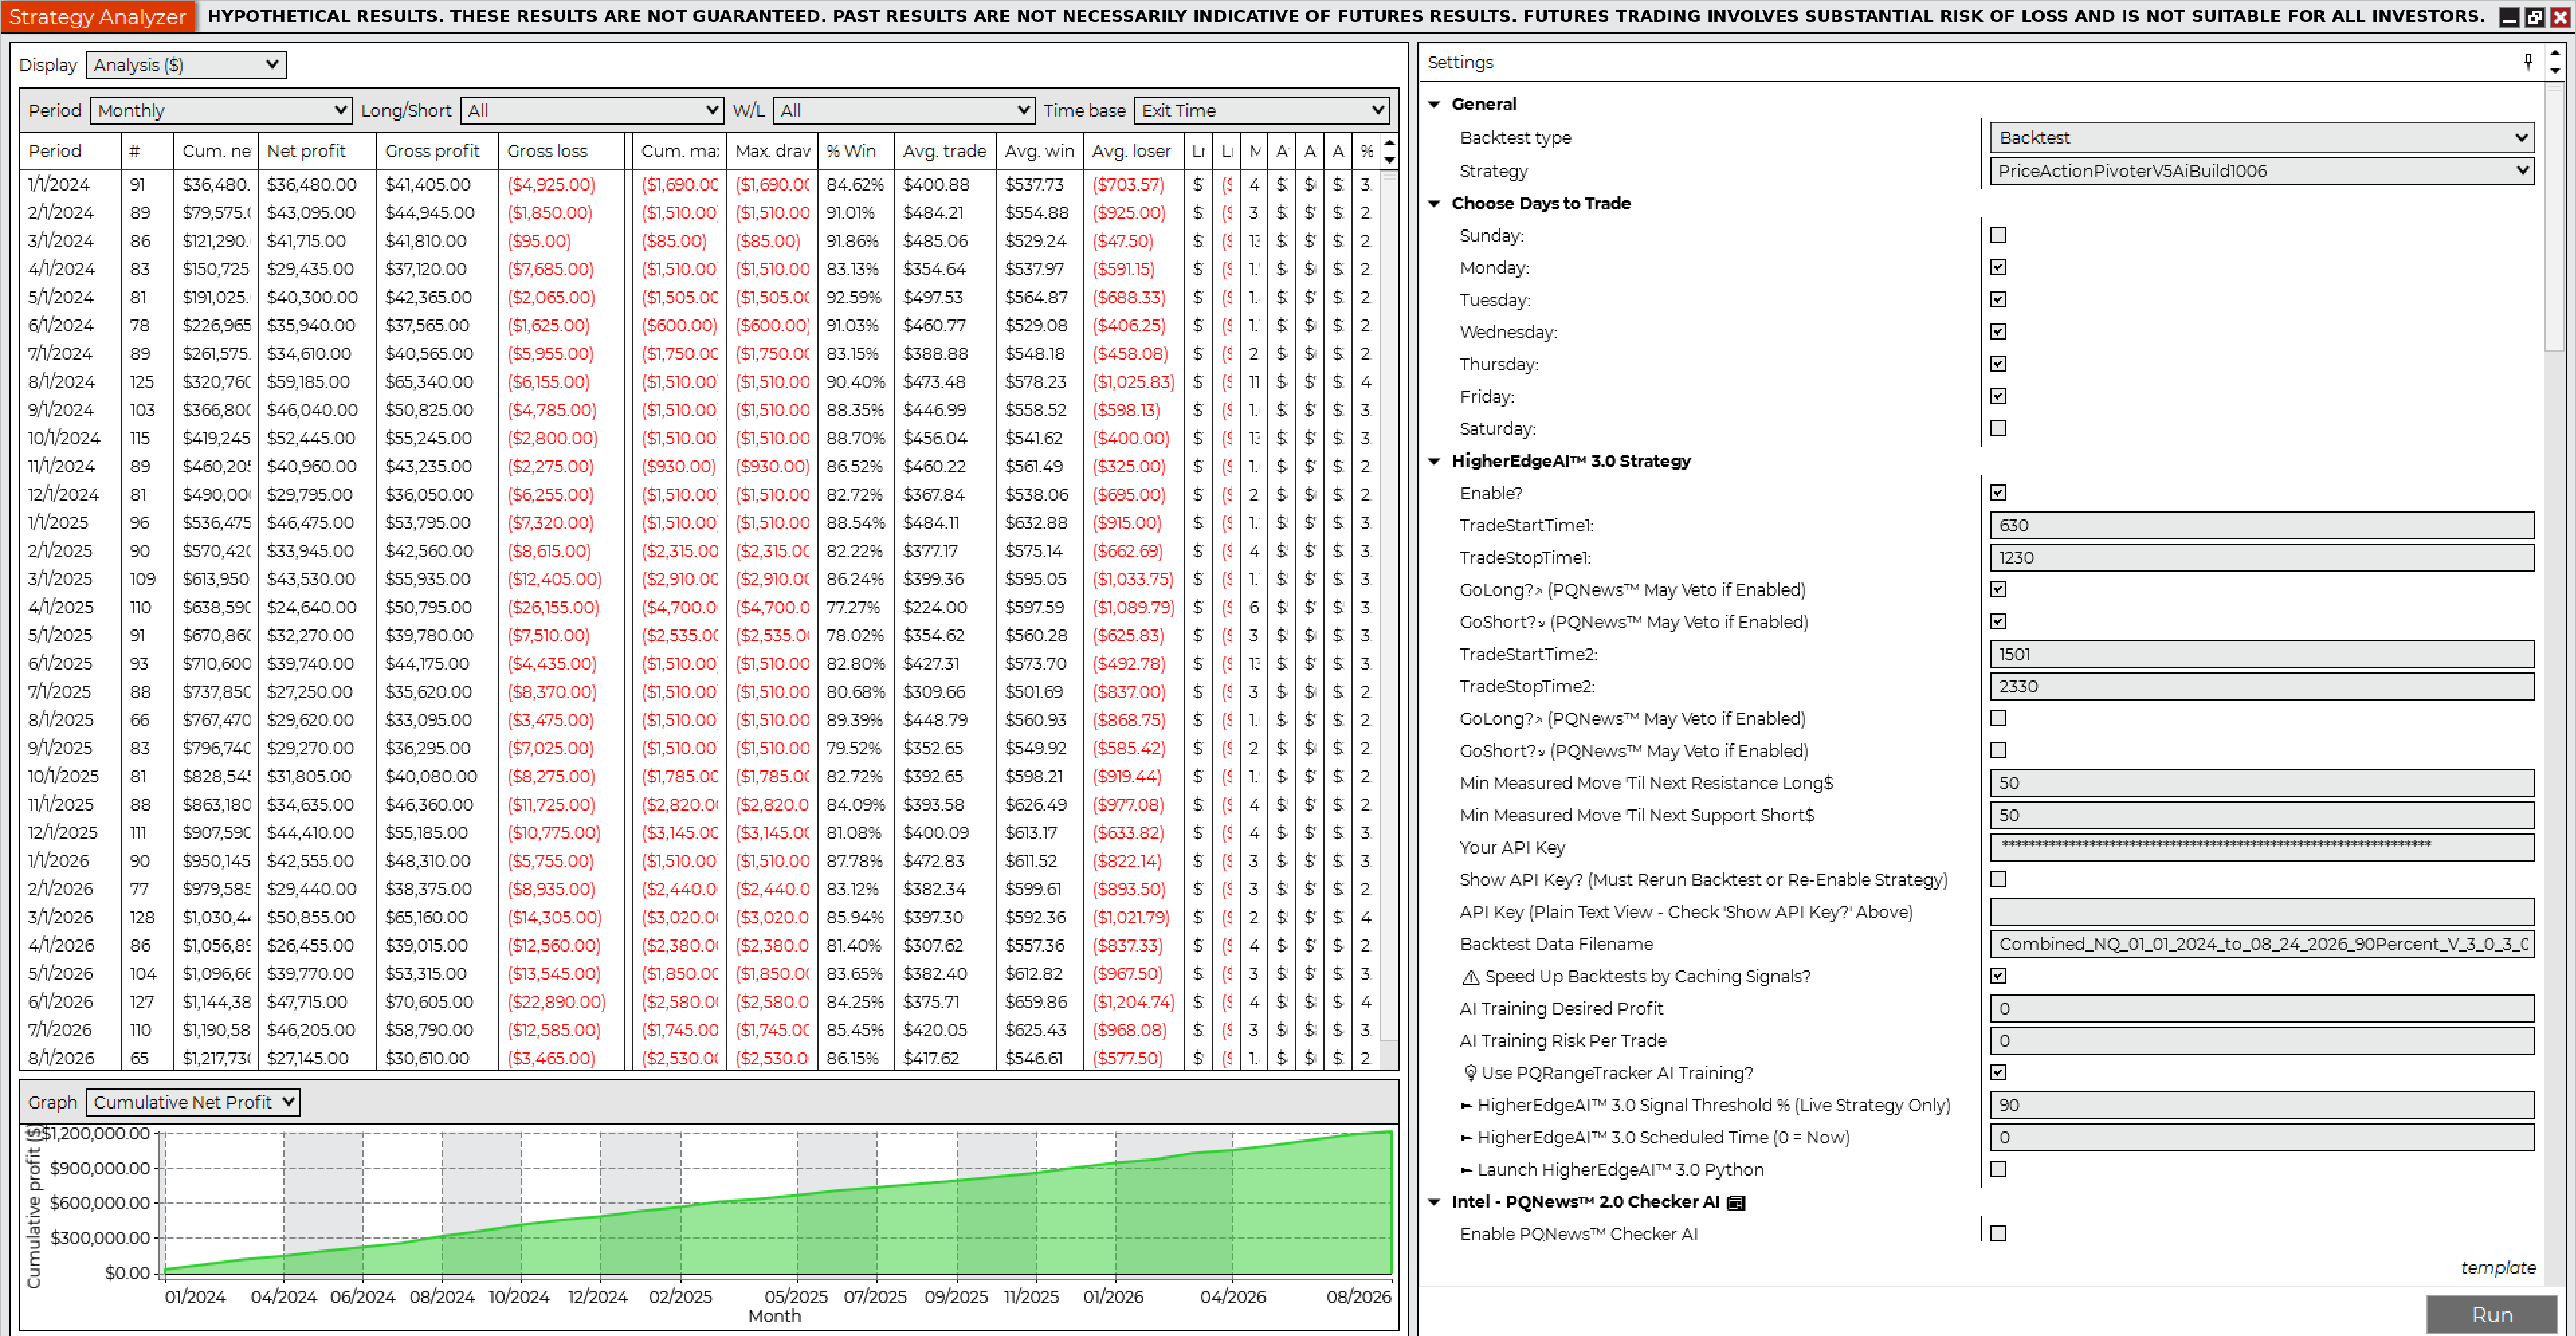
Backtest 7 · NQ · 1 Contract · 90% HigherEdgeAI™ 3.0 confidence
Net profit $1,217,730.00
Gross profit$1,474,325.00
Gross loss($256,595.00)
Profit factor5.75
Max drawdown($4,700.00)
Trades3,003
Win rate85.11%
Winning trades2,556
Losing trades321
Sharpe ratio2.25
Sortino ratio1.00
Avg time in market30.56 min
Max time to recover6.82 days
Longest flat period10.77 days
Average MAE$461.55
Average MFE$735.79
Contracts · slippage1 · 2 ticks
Jan 1, 2024 – Aug 24, 2026 · RTH 6:30 AM – 12:30 PM Pacific, flat by 12:59 PM · all market conditions including economic news events · commissions excluded (example: $5 × 3,003 = $15,015 round-trip).
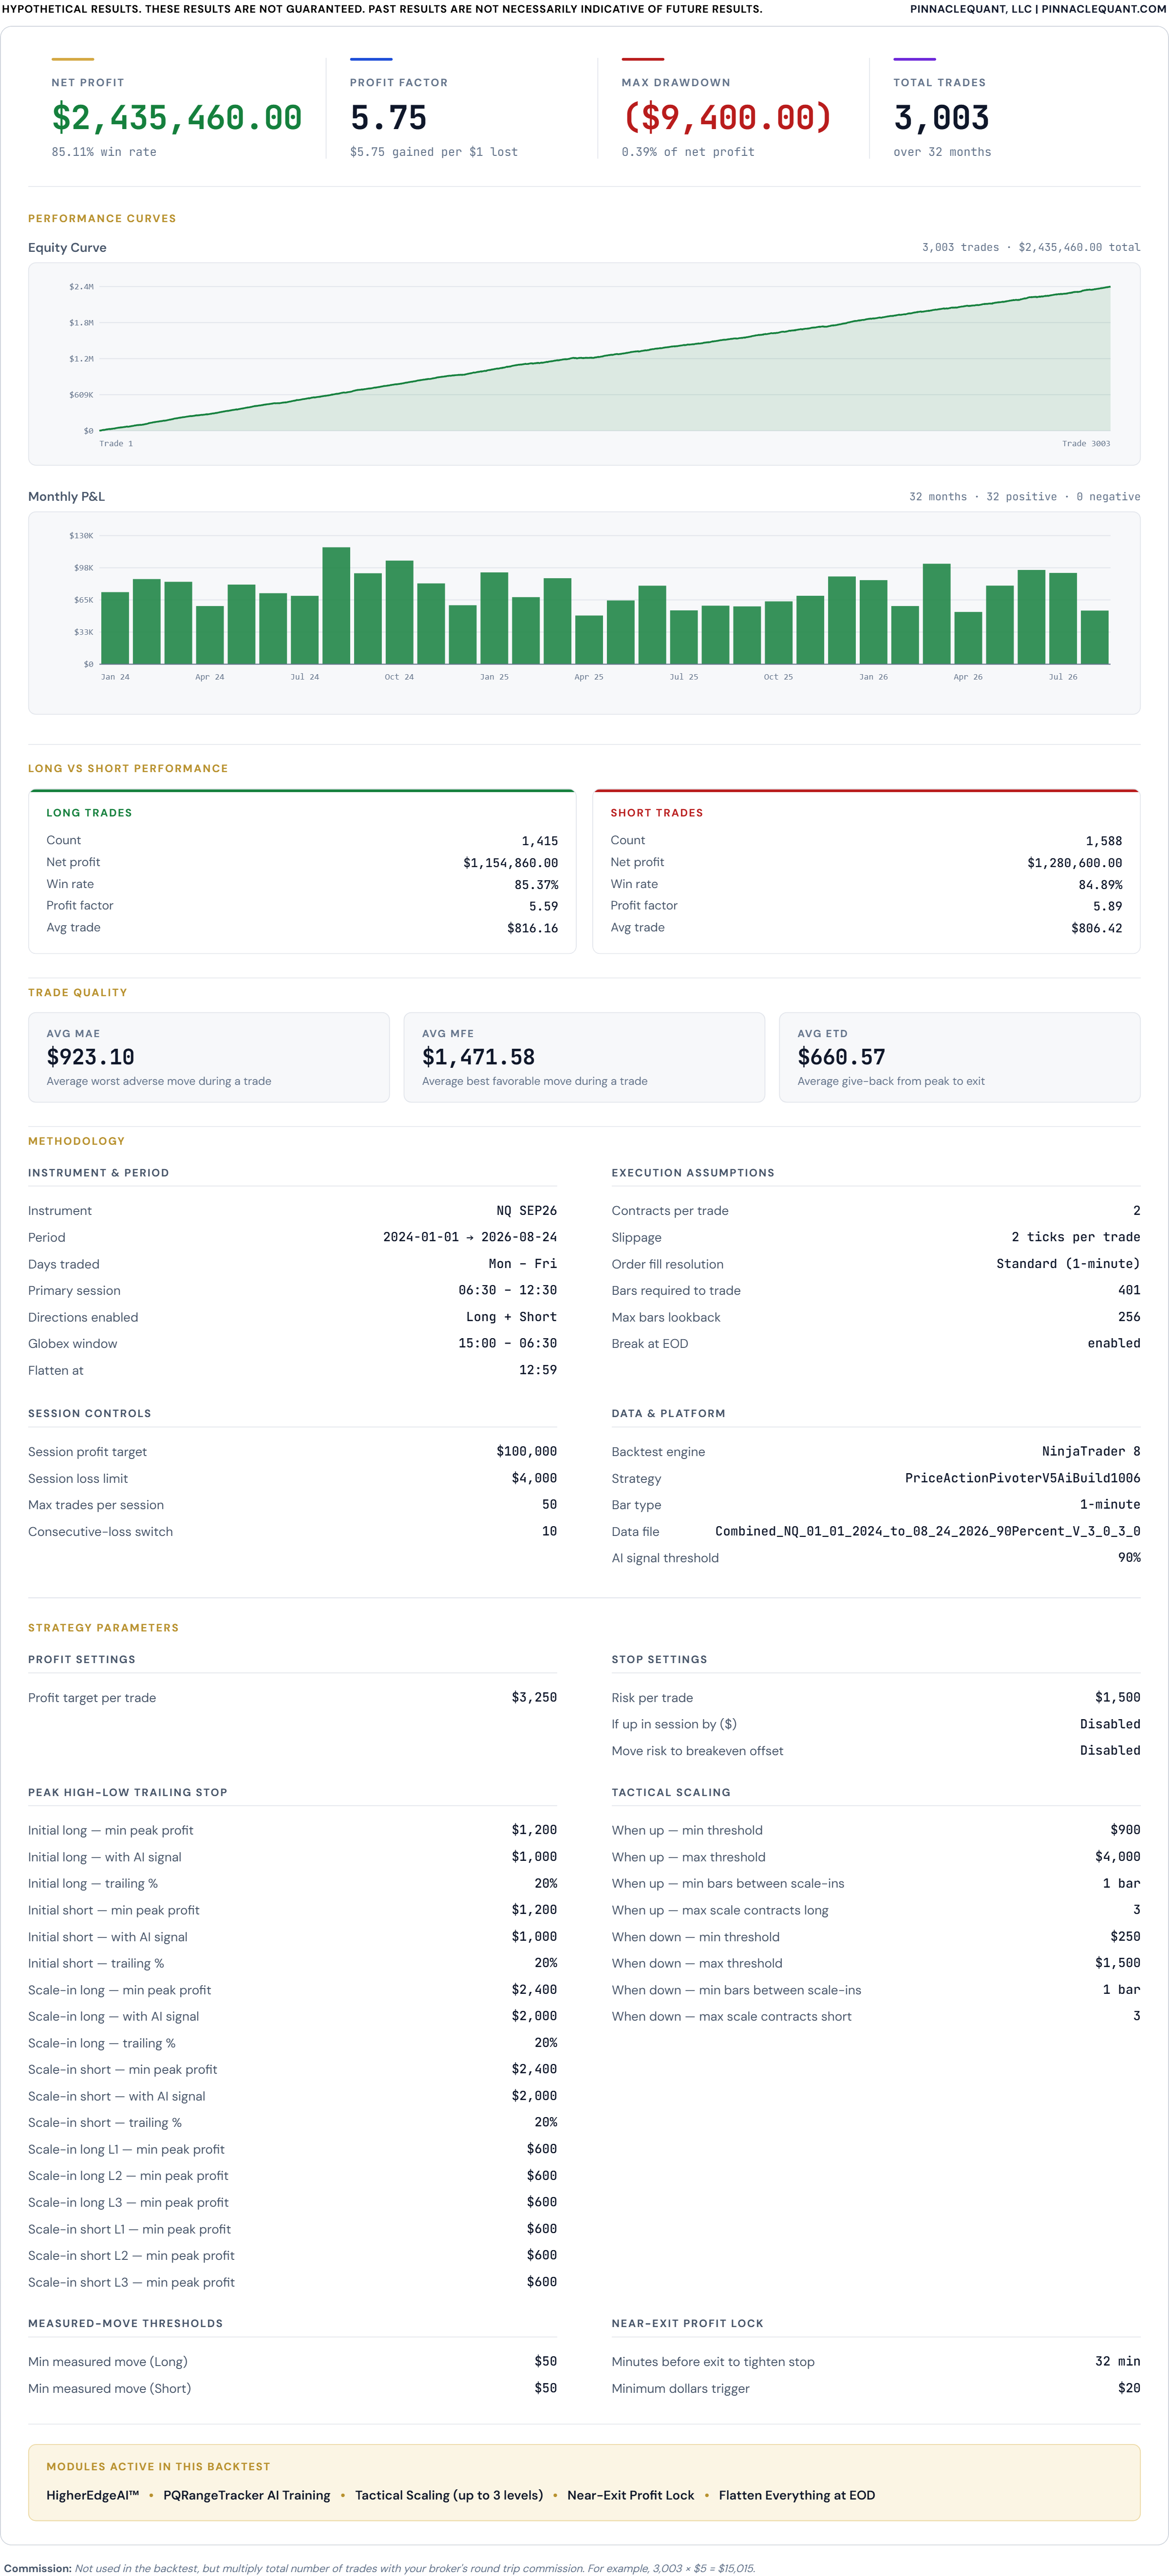
Backtest 8 · NQ · 2 Contracts · 90% HigherEdgeAI™ 3.0 confidence
Net profit $2,435,460.00
Gross profit$2,948,650.00
Gross loss($513,190.00)
Profit factor5.75
Max drawdown($9,400.00)
Trades3,003
Win rate85.11%
Winning trades2,556
Losing trades321
Sharpe ratio2.25
Sortino ratio1.00
Avg time in market30.56 min
Max time to recover6.82 days
Longest flat period10.77 days
Average MAE$923.10
Average MFE$1,471.58
Contracts · slippage2 · 2 ticks
Jan 1, 2024 – Aug 24, 2026 · RTH 6:30 AM – 12:30 PM Pacific, flat by 12:59 PM · all market conditions including economic news events · commissions excluded (example: $10 × 3,003 = $30,030 round-trip).

While no backtest is 100% accurate and past results are not necessarily indicative of future results, the above hypothetical backtests provide valuable insights into how this machine learning automated trading system uses real-time A.I. signals to identify trades and manage them throughout their full lifecycle, with granular user control over entries, exits, and risk management.

CFTC RULE 4.41 – HYPOTHETICAL OR SIMULATED PERFORMANCE RESULTS HAVE CERTAIN LIMITATIONS. UNLIKE AN ACTUAL PERFORMANCE RECORD, SIMULATED RESULTS DO NOT REPRESENT ACTUAL TRADING. ALSO, SINCE THE TRADES HAVE NOT BEEN EXECUTED, THE RESULTS MAY HAVE UNDER-OR-OVER COMPENSATED FOR THE IMPACT, IF ANY, OF CERTAIN MARKET FACTORS, SUCH AS LACK OF LIQUIDITY. SIMULATED TRADING PROGRAMS IN GENERAL ARE ALSO SUBJECT TO THE FACT THAT THEY ARE DESIGNED WITH THE BENEFIT OF HINDSIGHT. NO REPRESENTATION IS BEING MADE THAT ANY ACCOUNT WILL OR IS LIKELY TO ACHIEVE PROFIT OR LOSSES SIMILAR TO THOSE SHOWN.
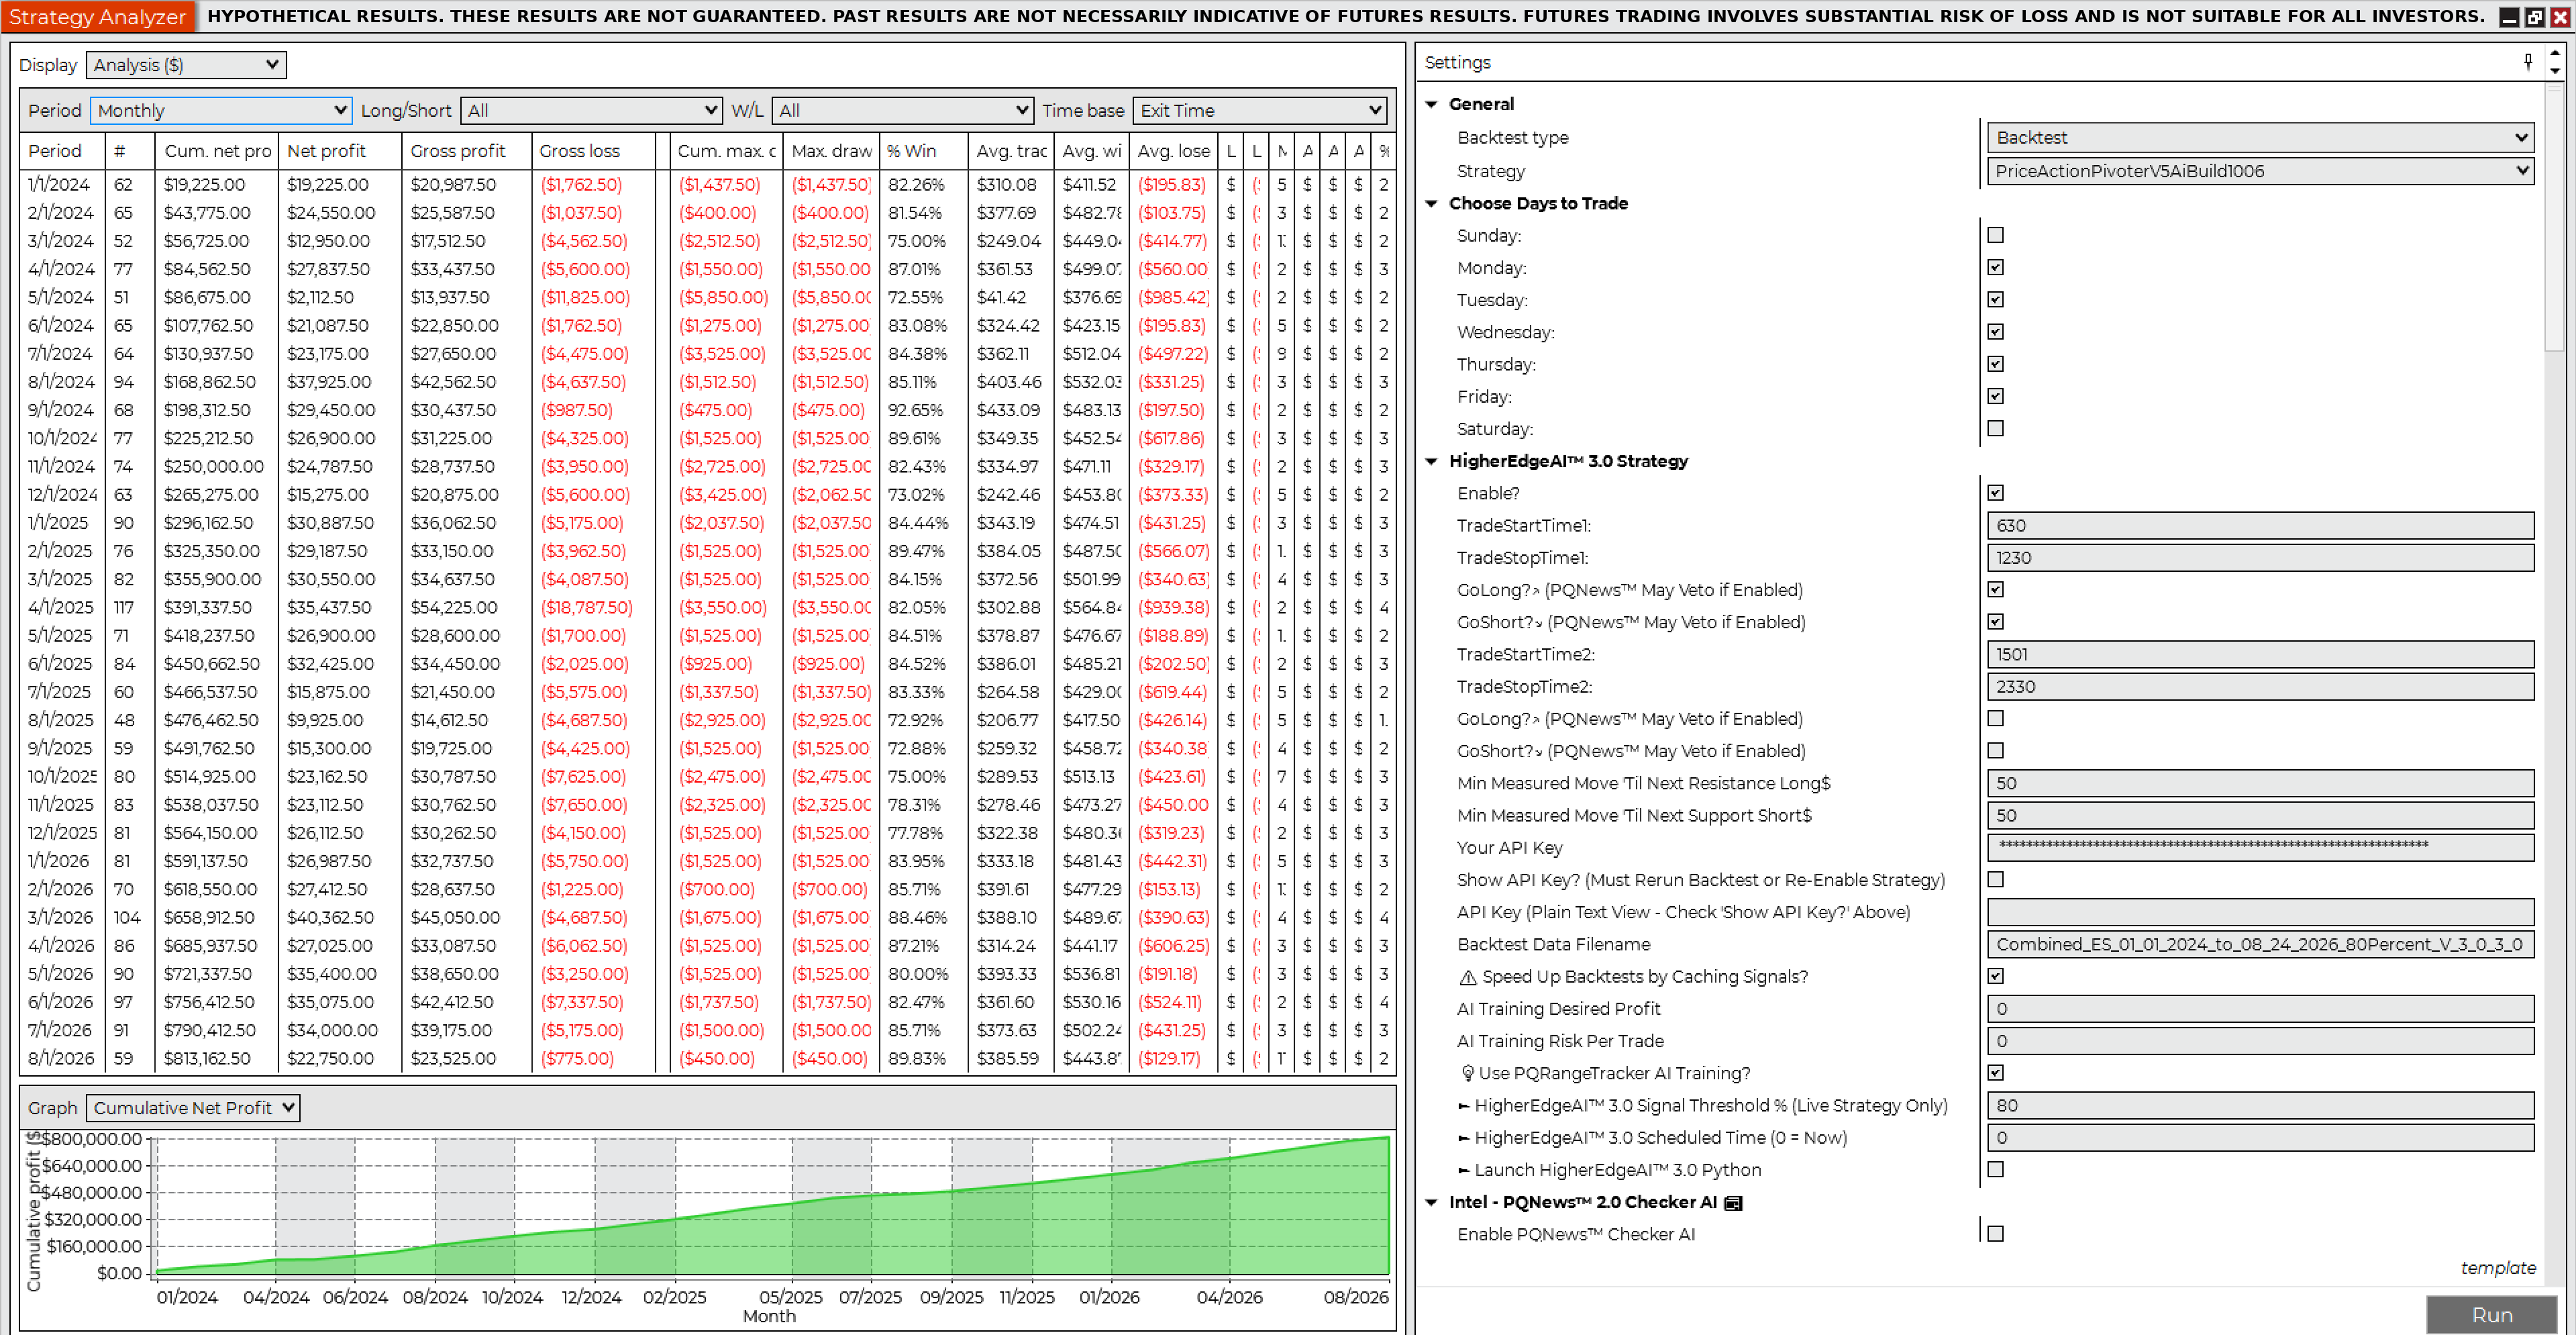
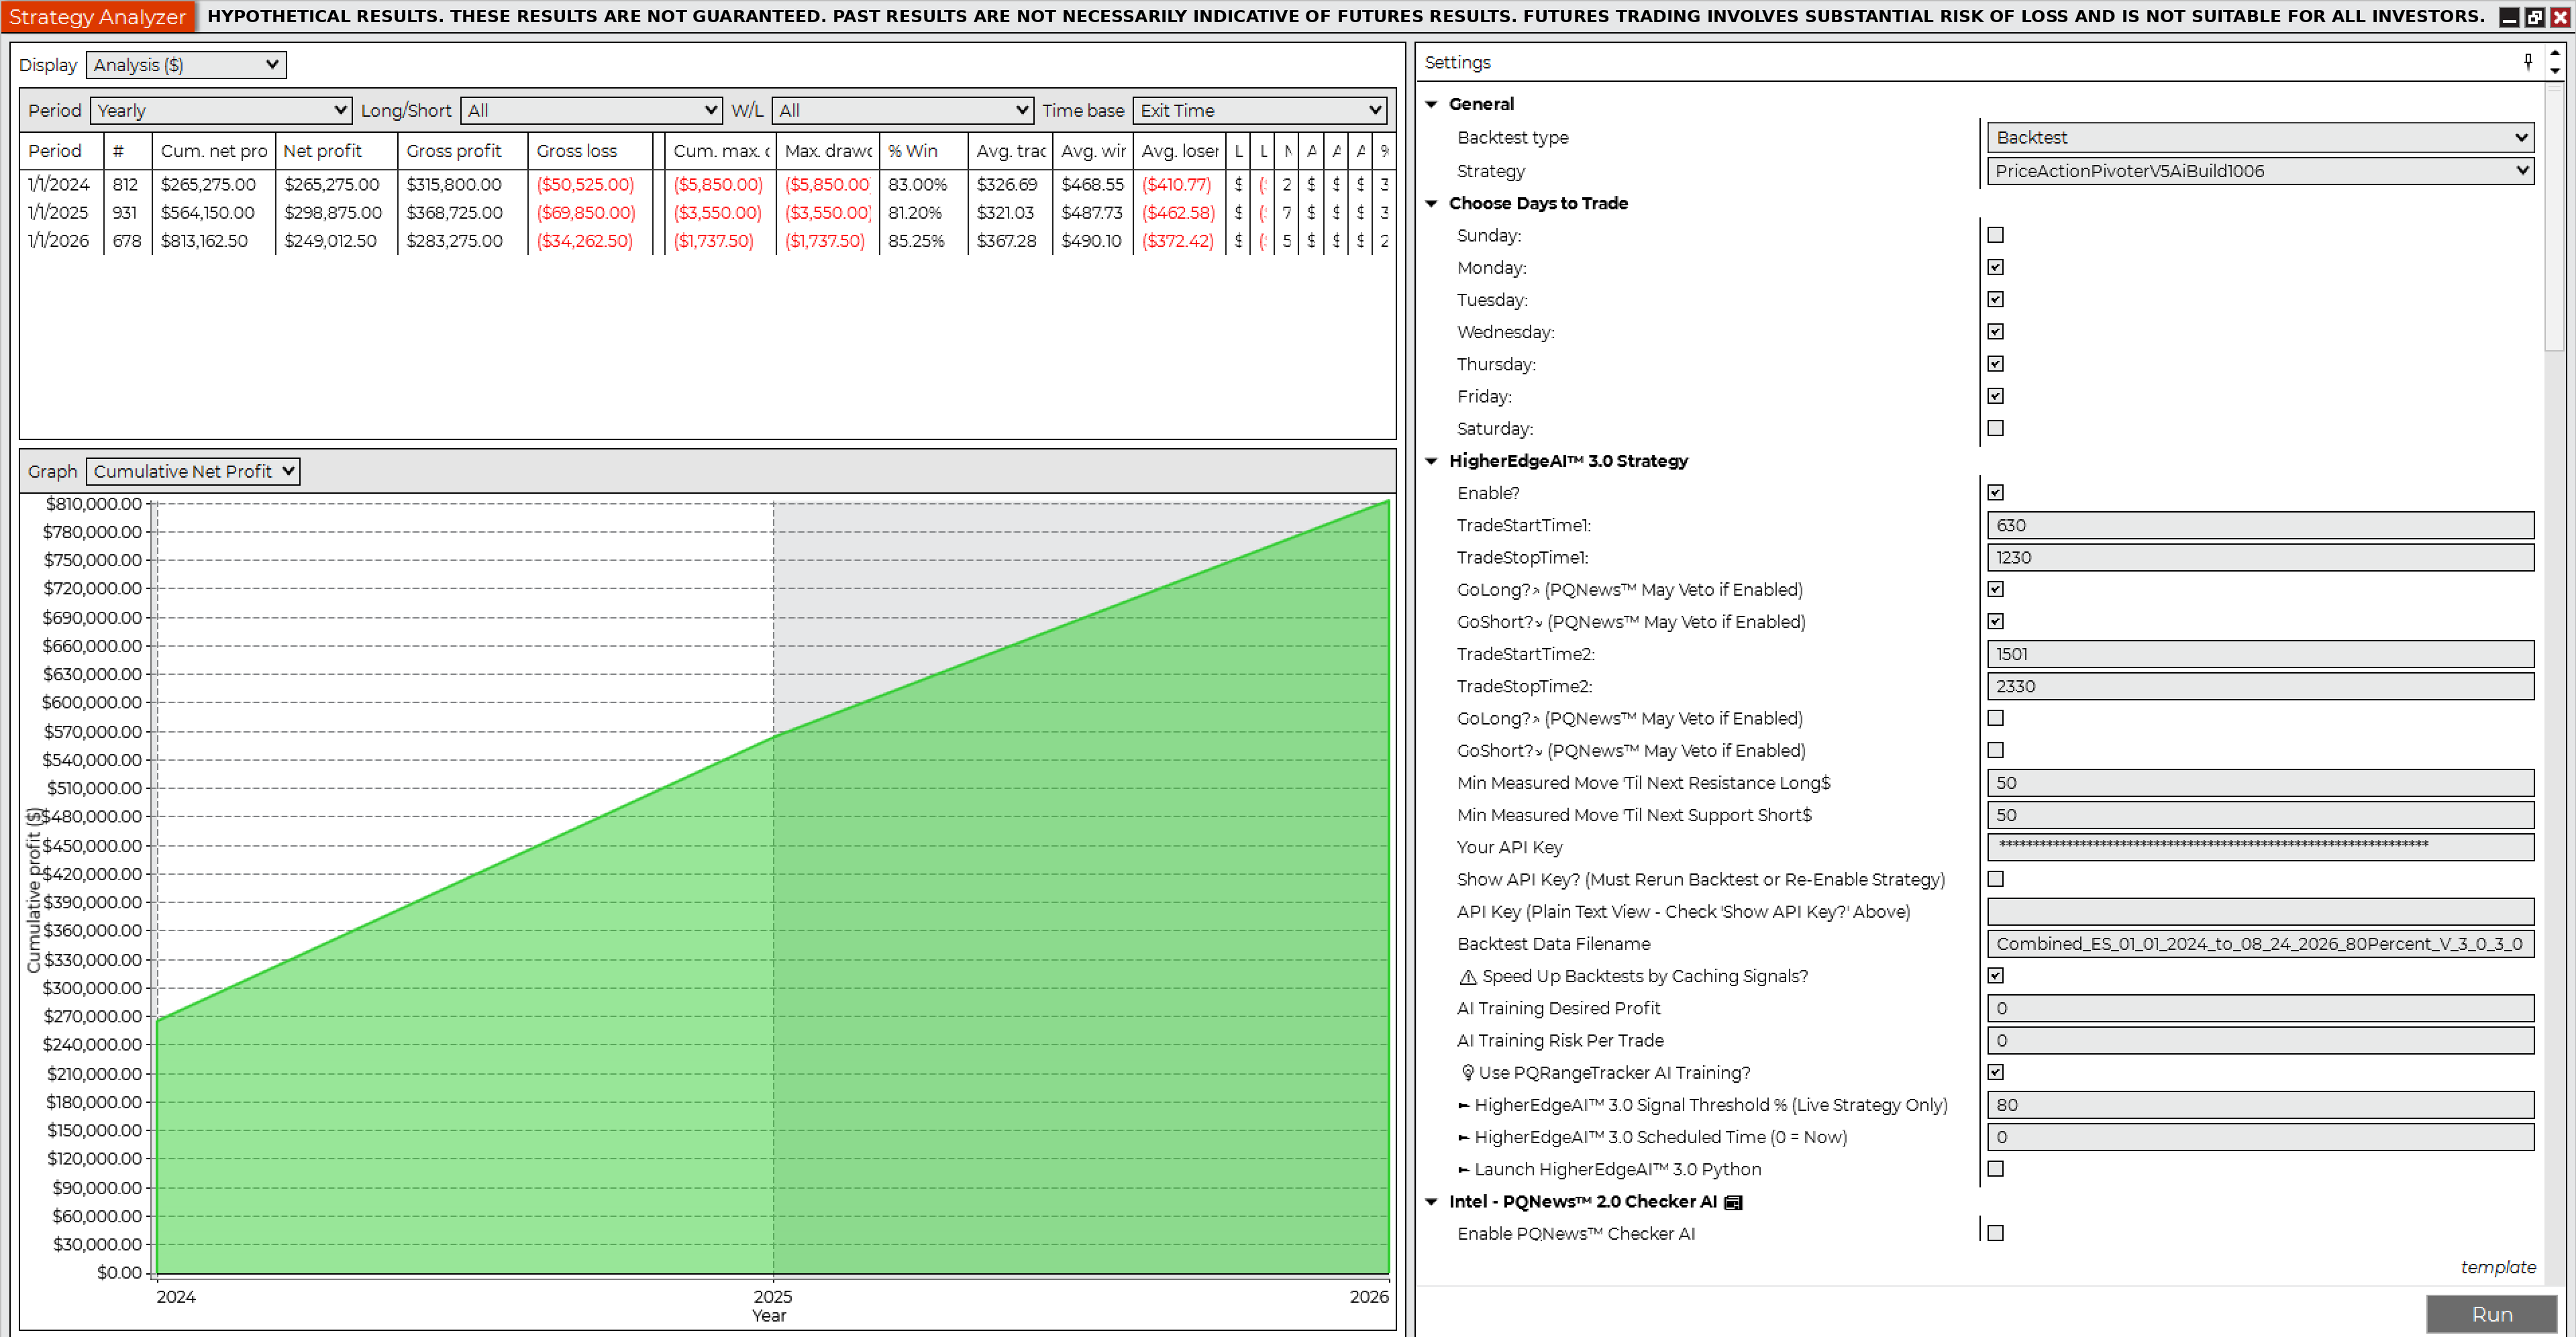
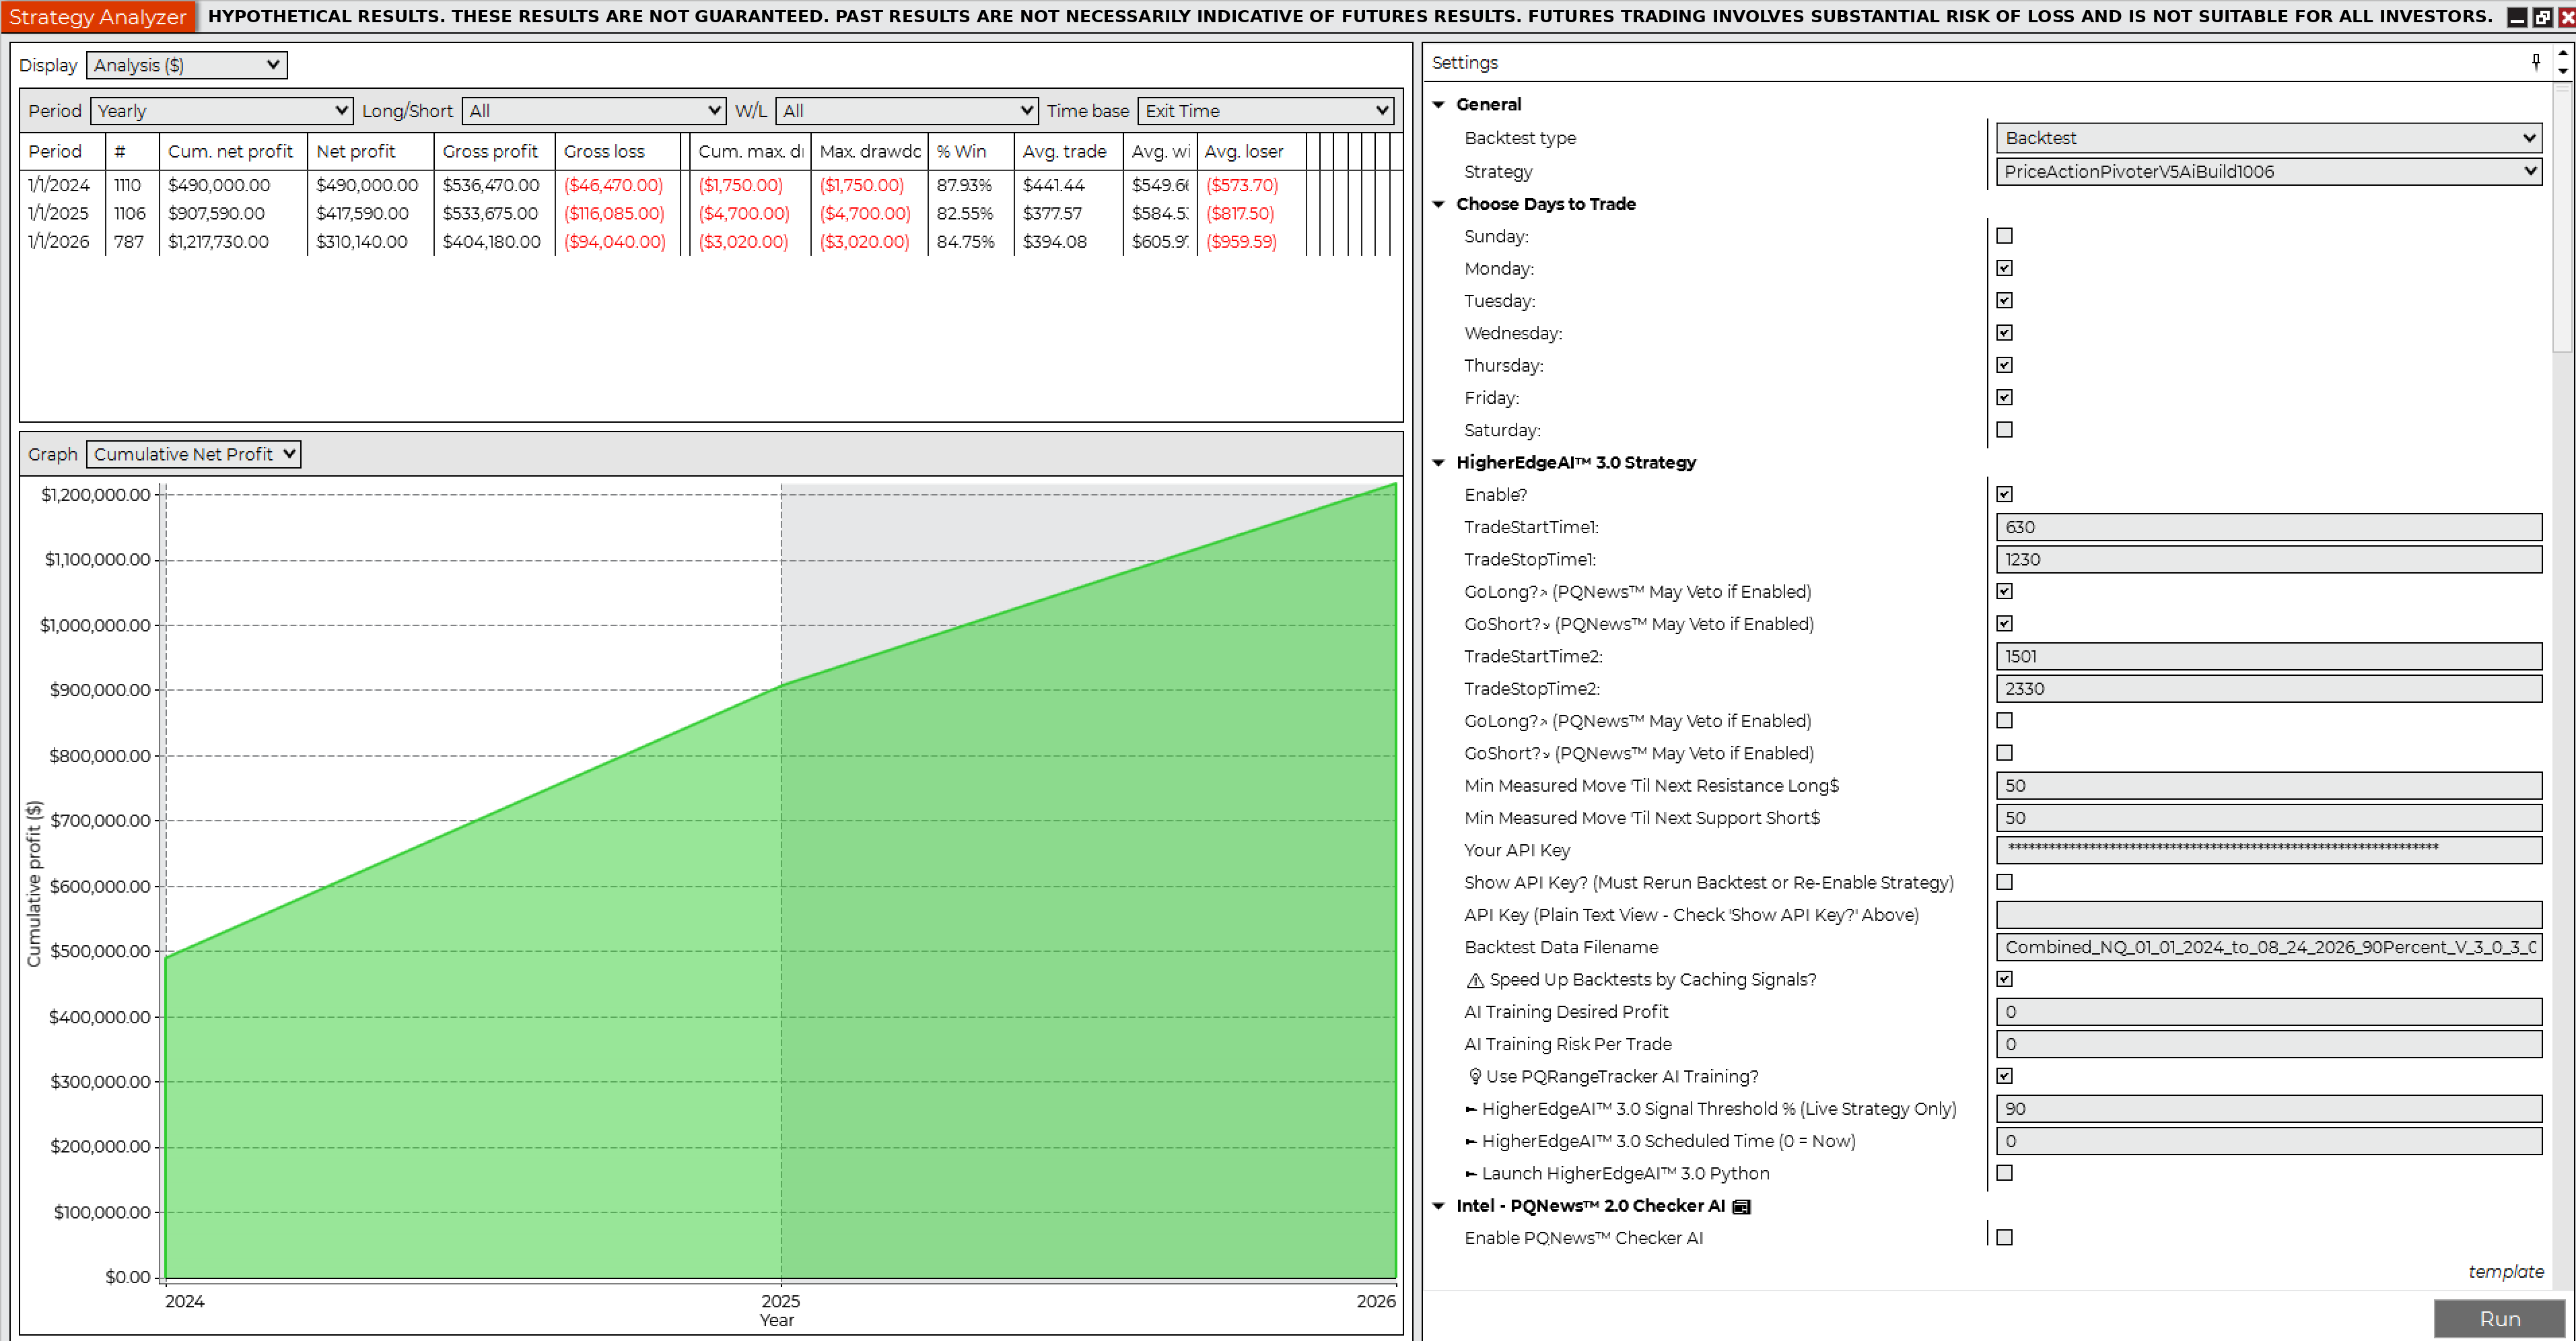
Backtest 1 · NinjaTrader Strategy AnalyzerES · 1 Contract · 80% HigherEdgeAI™ 3.0 Confidence Threshold
Hypothetical net profit$813,162.50

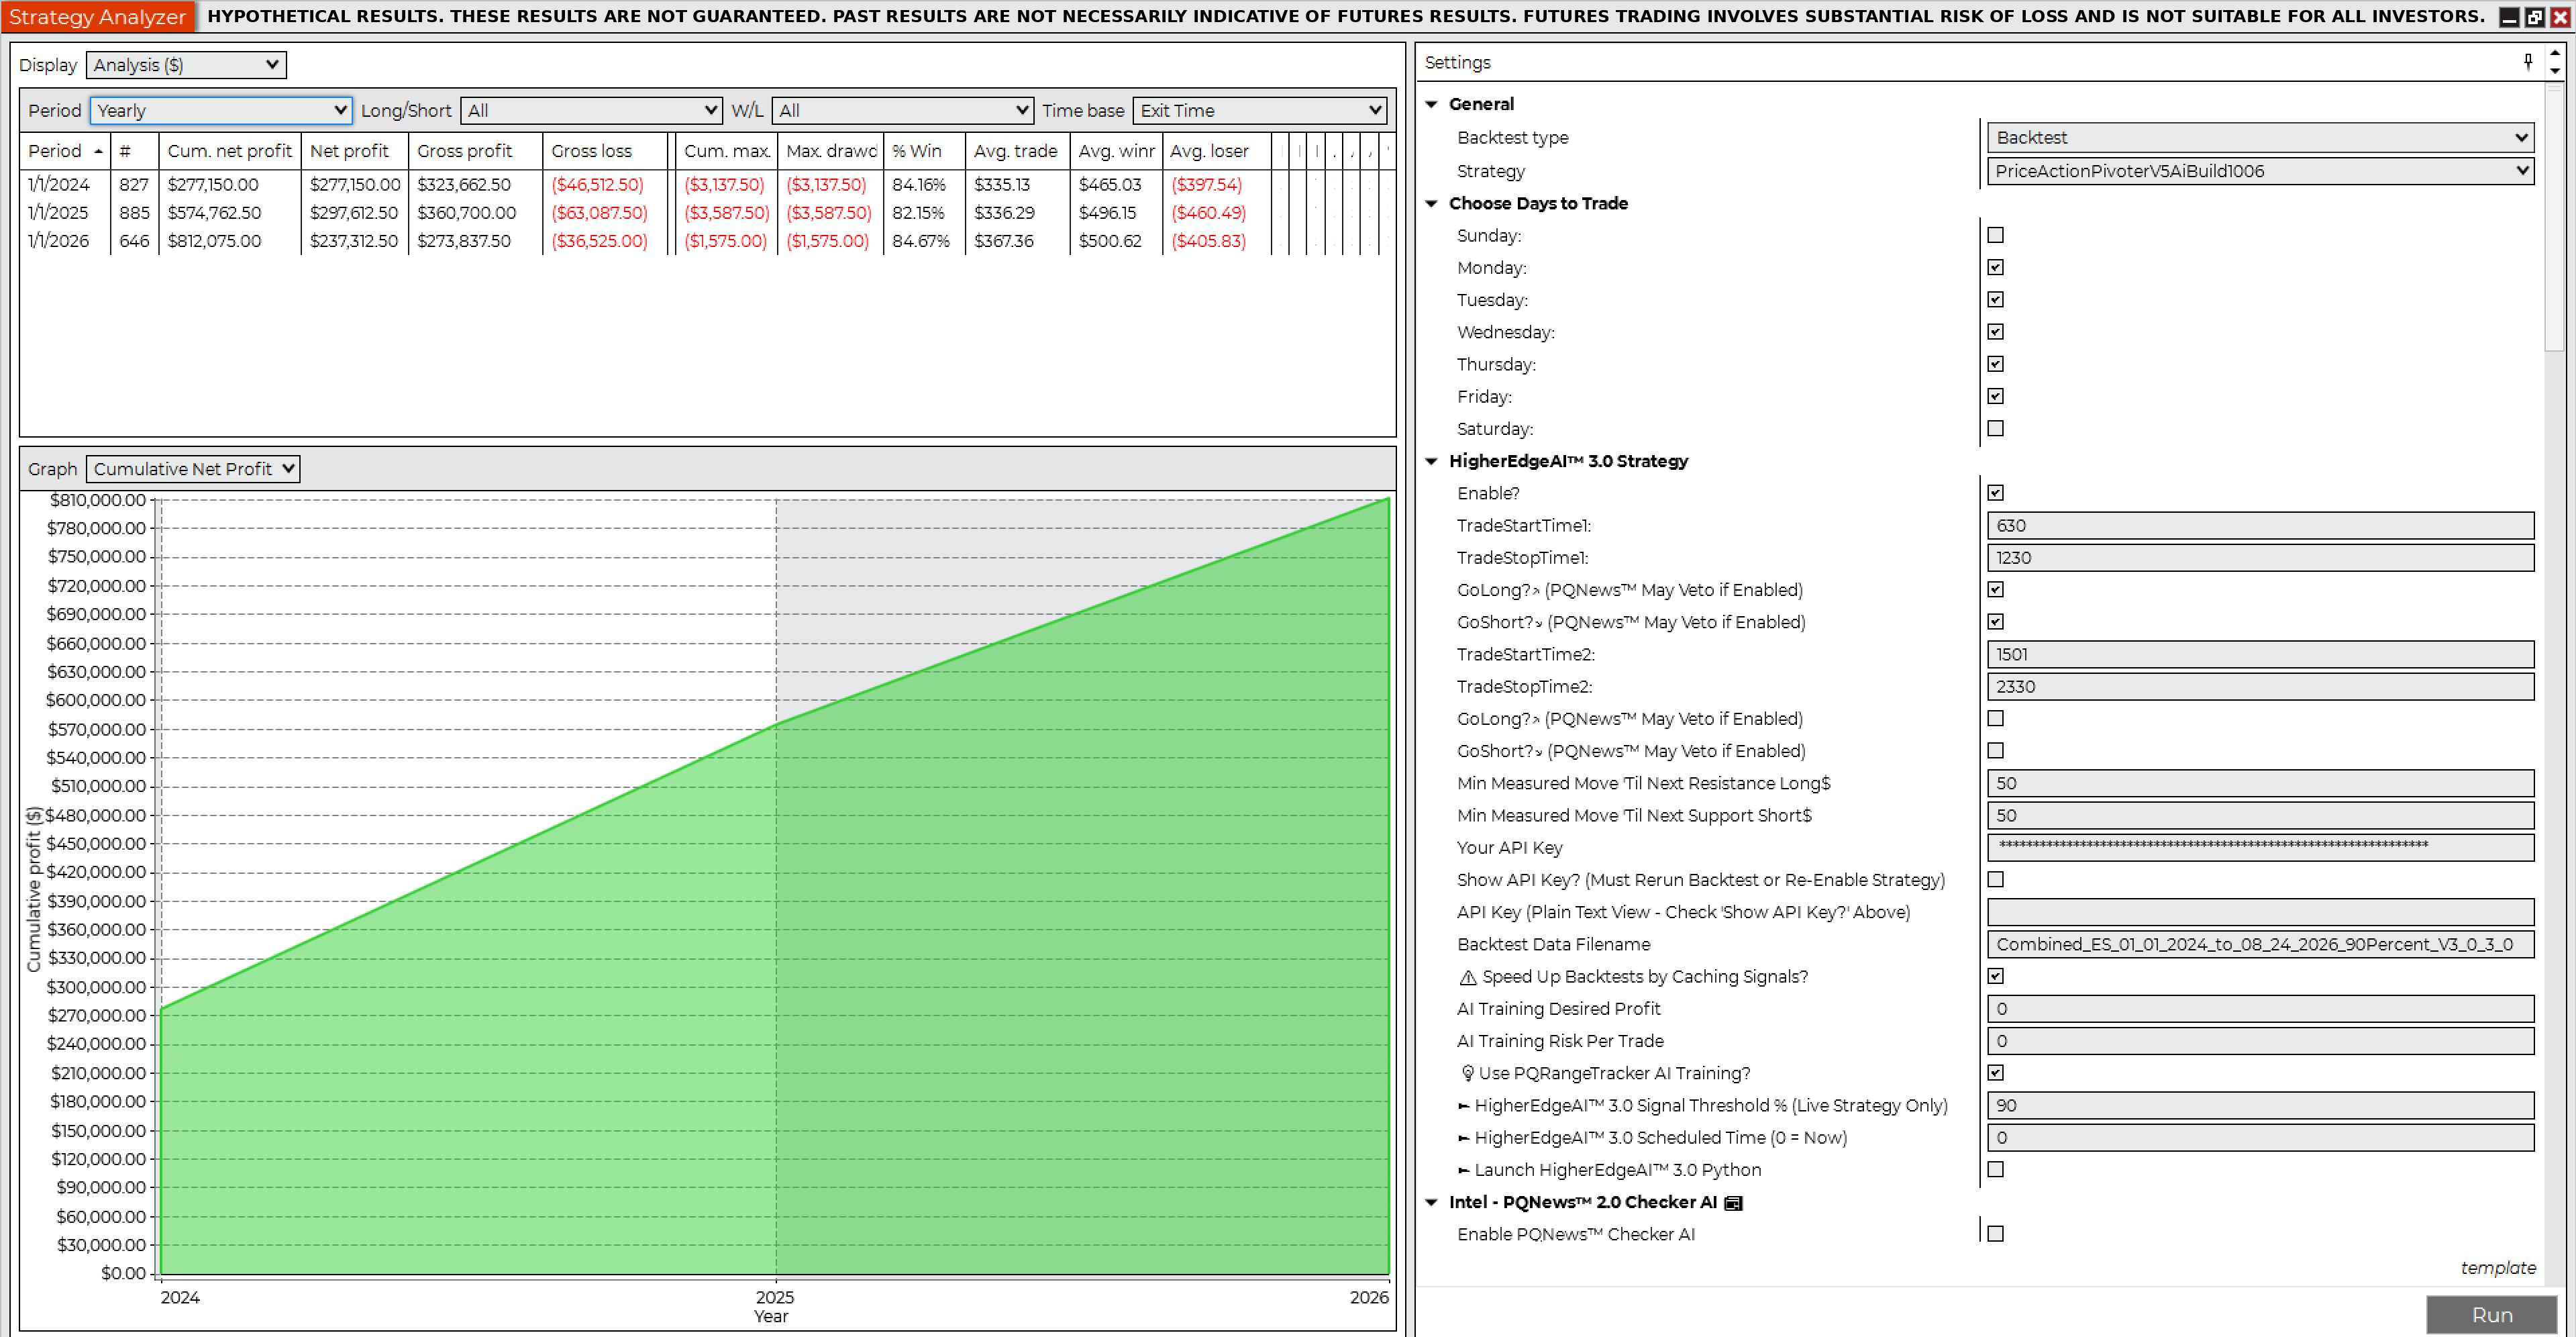
NinjaTrader Strategy Analyzer Summary, Backtest 1, ES 1 Contract 80%NinjaTrader Strategy Analyzer Monthly, Backtest 1, ES 1 Contract 80%NinjaTrader Strategy Analyzer Yearly, Backtest 1, ES 1 Contract 80%

NinjaTrader trade details, Backtest 1
Net profit$813,162.50
Gross profit$967,800.00
Gross loss($154,637.50)
Profit factor6.26
Max drawdown($5,850.00)
Number of trades2,421
Win rate82.94%
Winning trades2,008
Losing trades366
Start date1/1/2024
End date8/24/2026
Hours traded6:30 AM – 12:30 PM Pacific
Flatten everything12:59 PM Pacific
Sortino ratio1.00
Sharpe ratio2.05
Average time in market67.23 min
Max time to recover28.05 days
Longest flat period10.77 days
Average MAE$349.14
Average MFE$619.36
Market conditionAll, incl. economic news events
Contracts1
Slippage2 ticks
CommissionNot included; e.g. $5 × 2,421 = $12,105
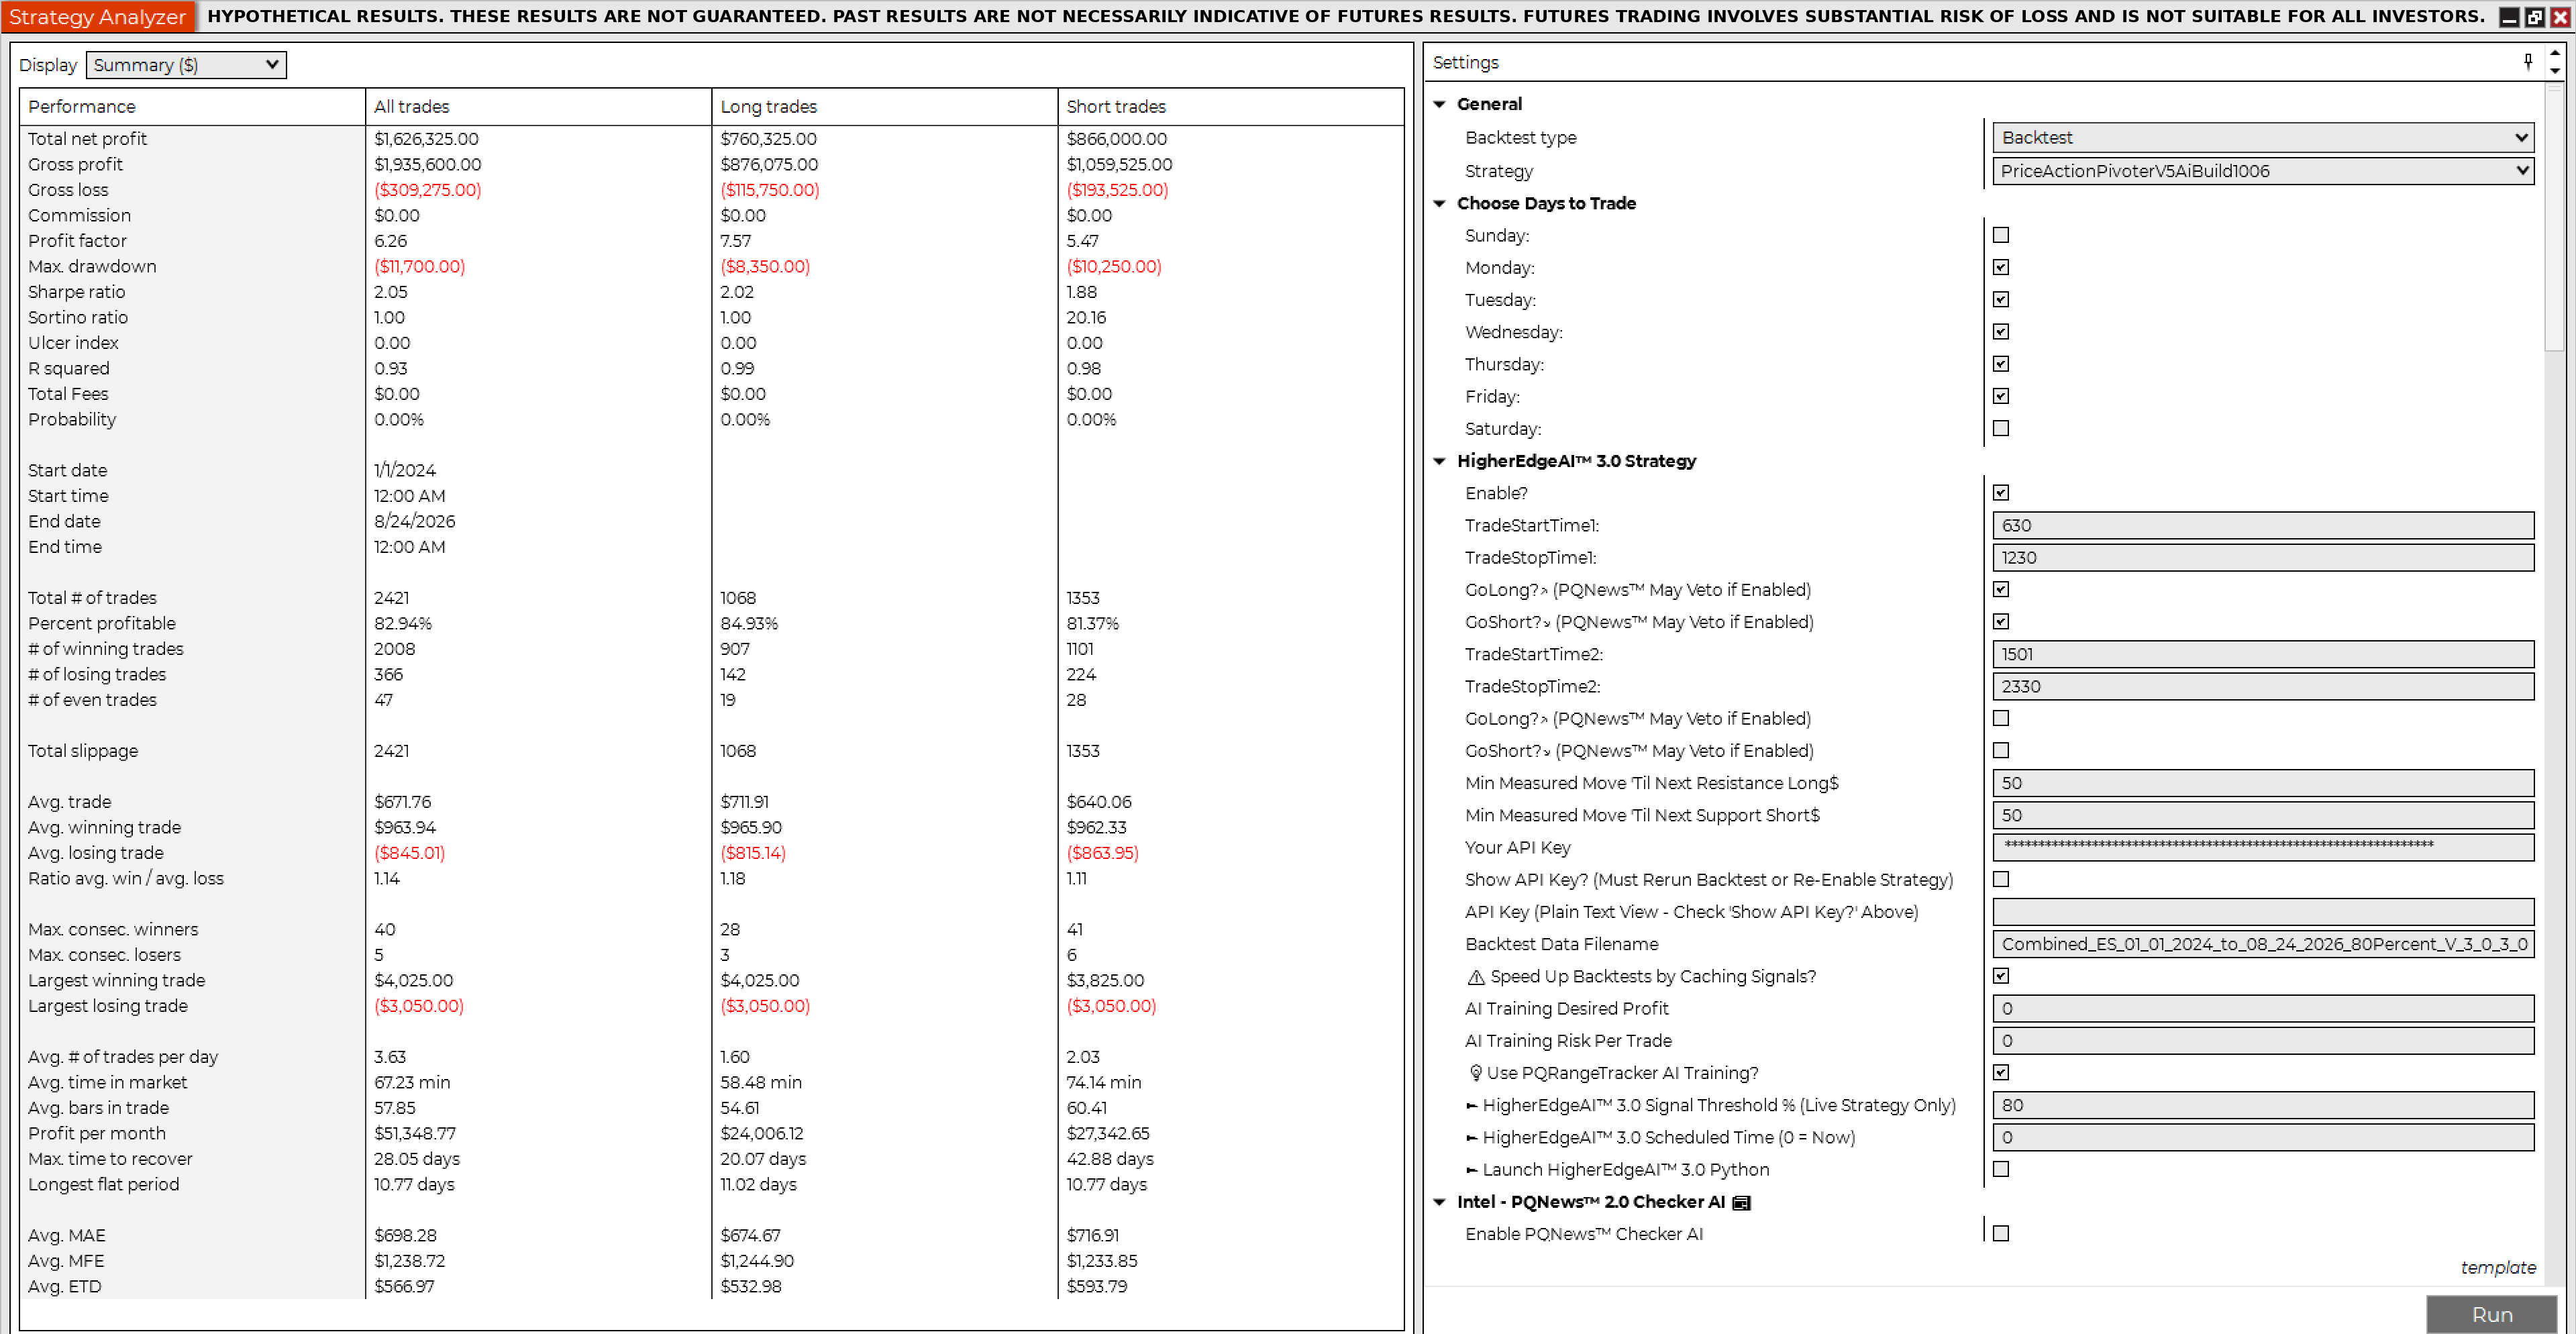
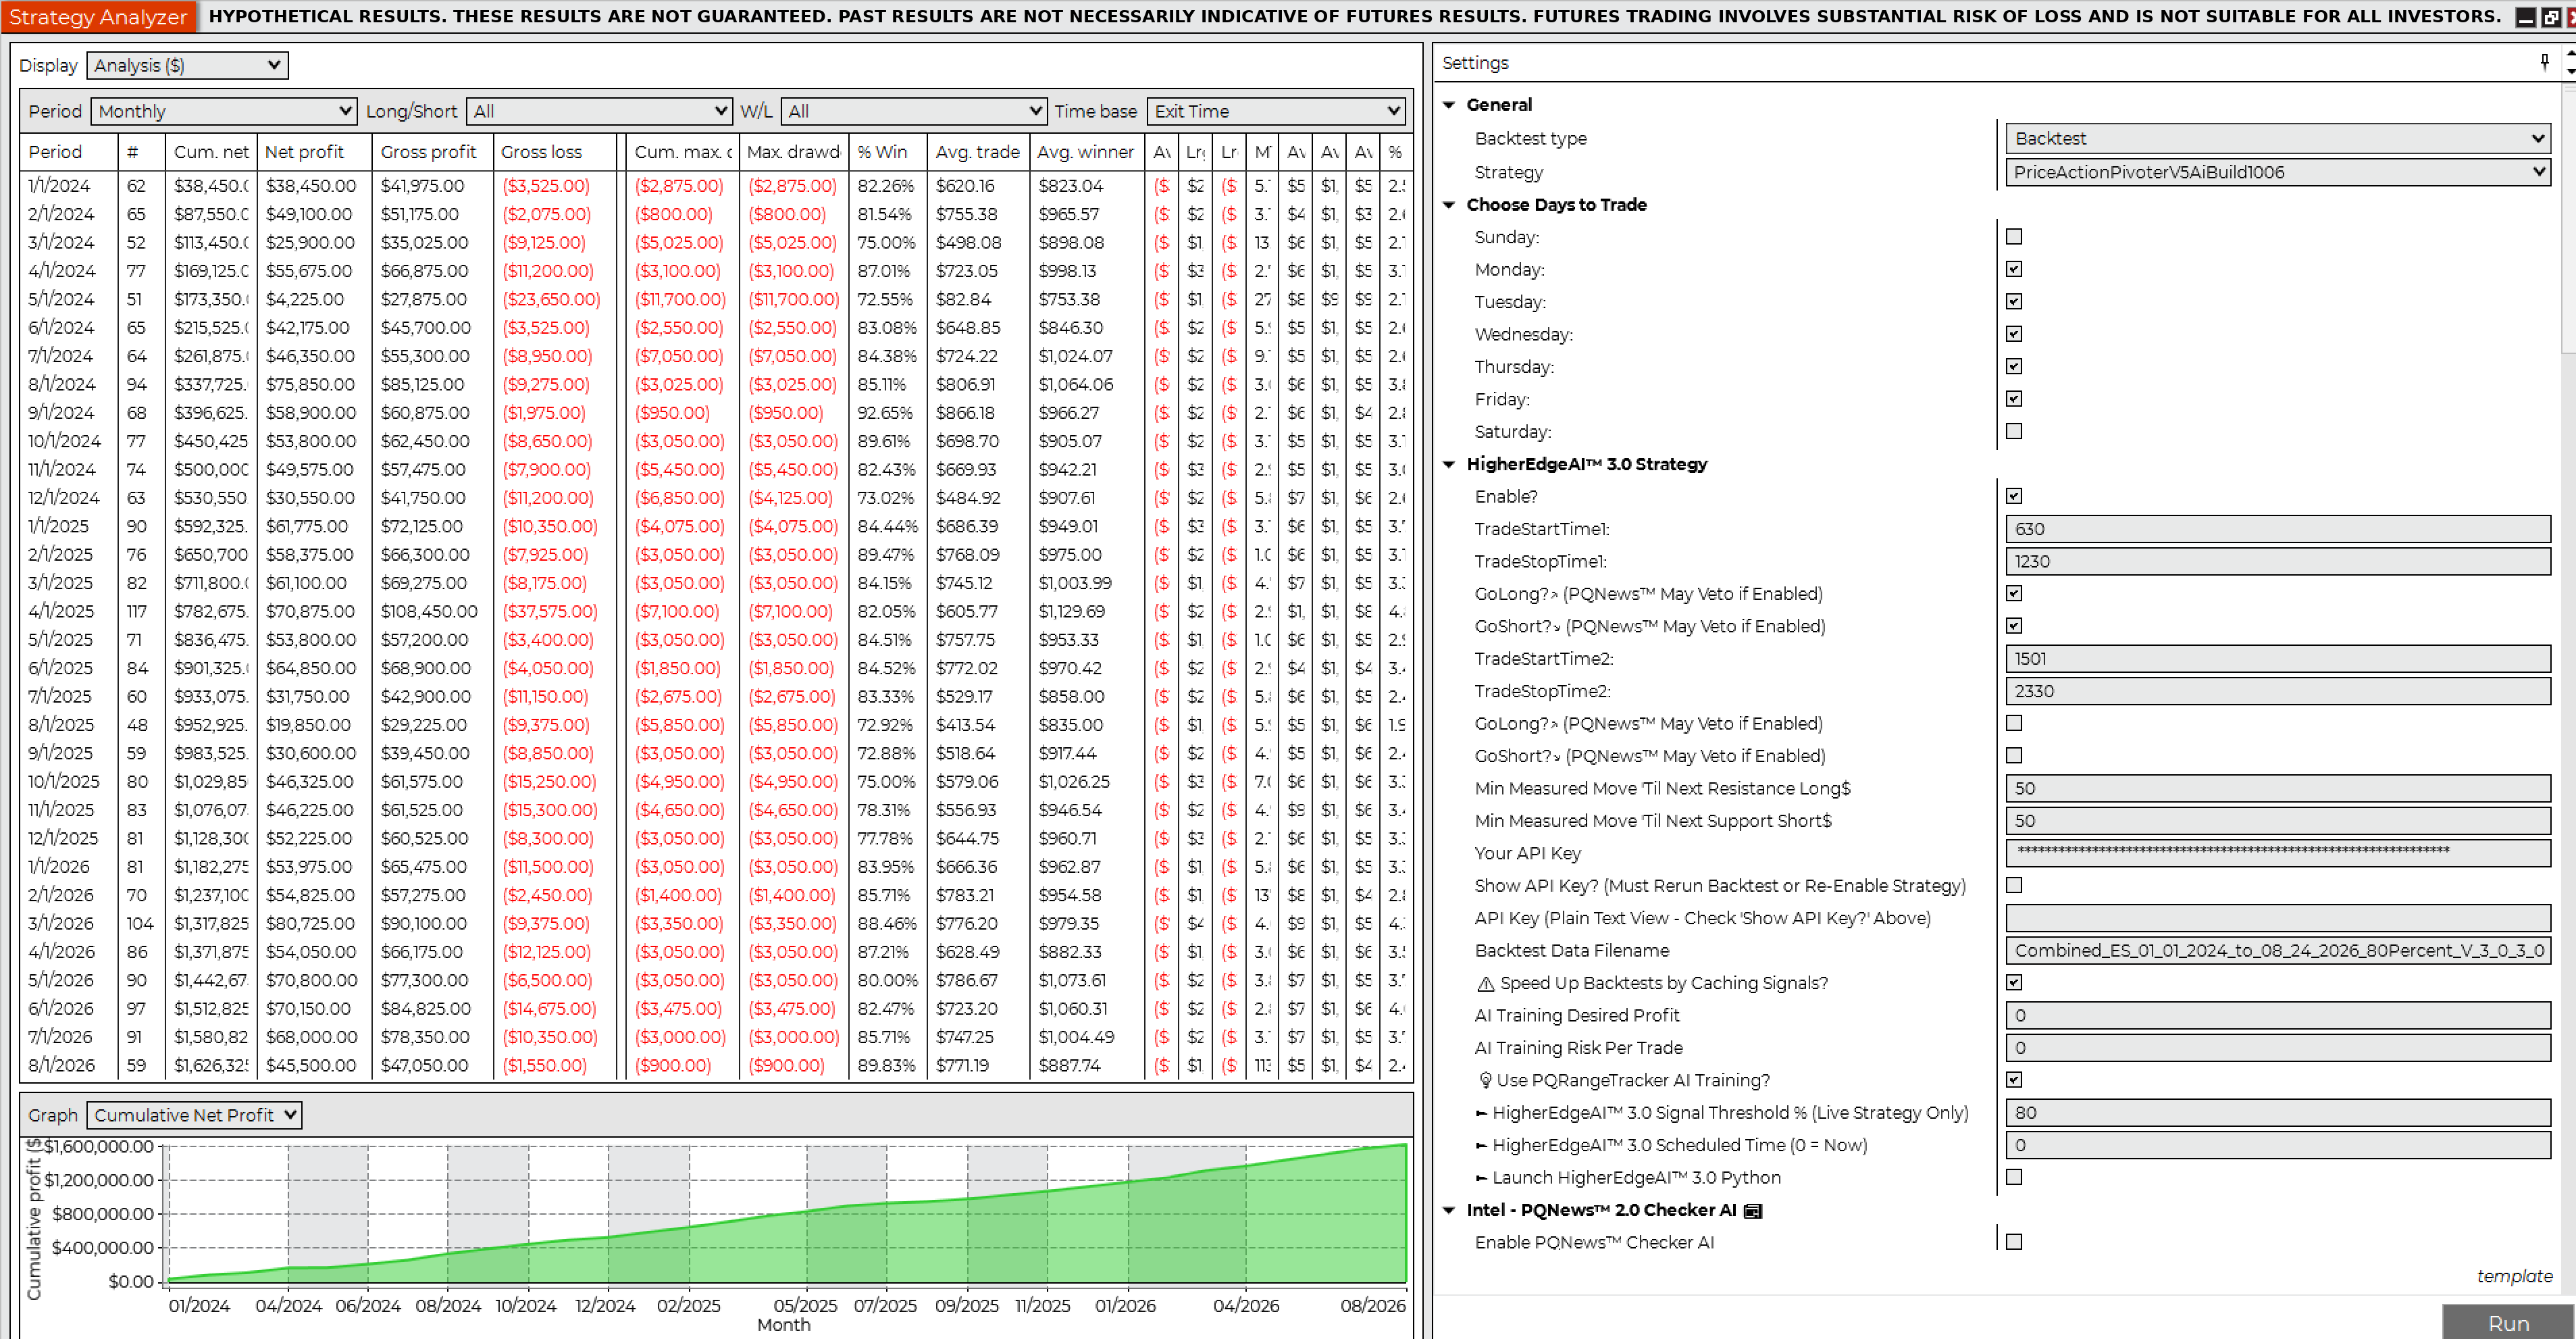
Backtest 2 · NinjaTrader Strategy AnalyzerES · 2 Contracts · 80% HigherEdgeAI™ 3.0 Confidence Threshold
Hypothetical net profit$1,626,325.00

NinjaTrader Strategy Analyzer Summary, Backtest 2, ES 2 Contracts 80%NinjaTrader Strategy Analyzer Monthly, Backtest 2, ES 2 Contracts 80%NinjaTrader Strategy Analyzer Yearly, Backtest 2, ES 2 Contracts 80%

NinjaTrader trade details, Backtest 2
Net profit$1,626,325.00
Gross profit$1,935,600.00
Gross loss($309,275.00)
Profit factor6.26
Max drawdown($11,700.00)
Number of trades2,421
Win rate82.94%
Winning trades2,008
Losing trades366
Start date1/1/2024
End date8/24/2026
Hours traded6:30 AM – 12:30 PM Pacific
Flatten everything12:59 PM Pacific
Sortino ratio1.00
Sharpe ratio2.05
Average time in market67.23 min
Max time to recover28.05 days
Longest flat period10.77 days
Average MAE$698.28
Average MFE$1,238.72
Market conditionAll, incl. economic news events
Contracts2
Slippage2 ticks
CommissionNot included; e.g. $10 × 2,421 = $24,210
Backtest 3 · NinjaTrader Strategy AnalyzerES · 1 Contract · 90% HigherEdgeAI™ 3.0 Confidence Threshold
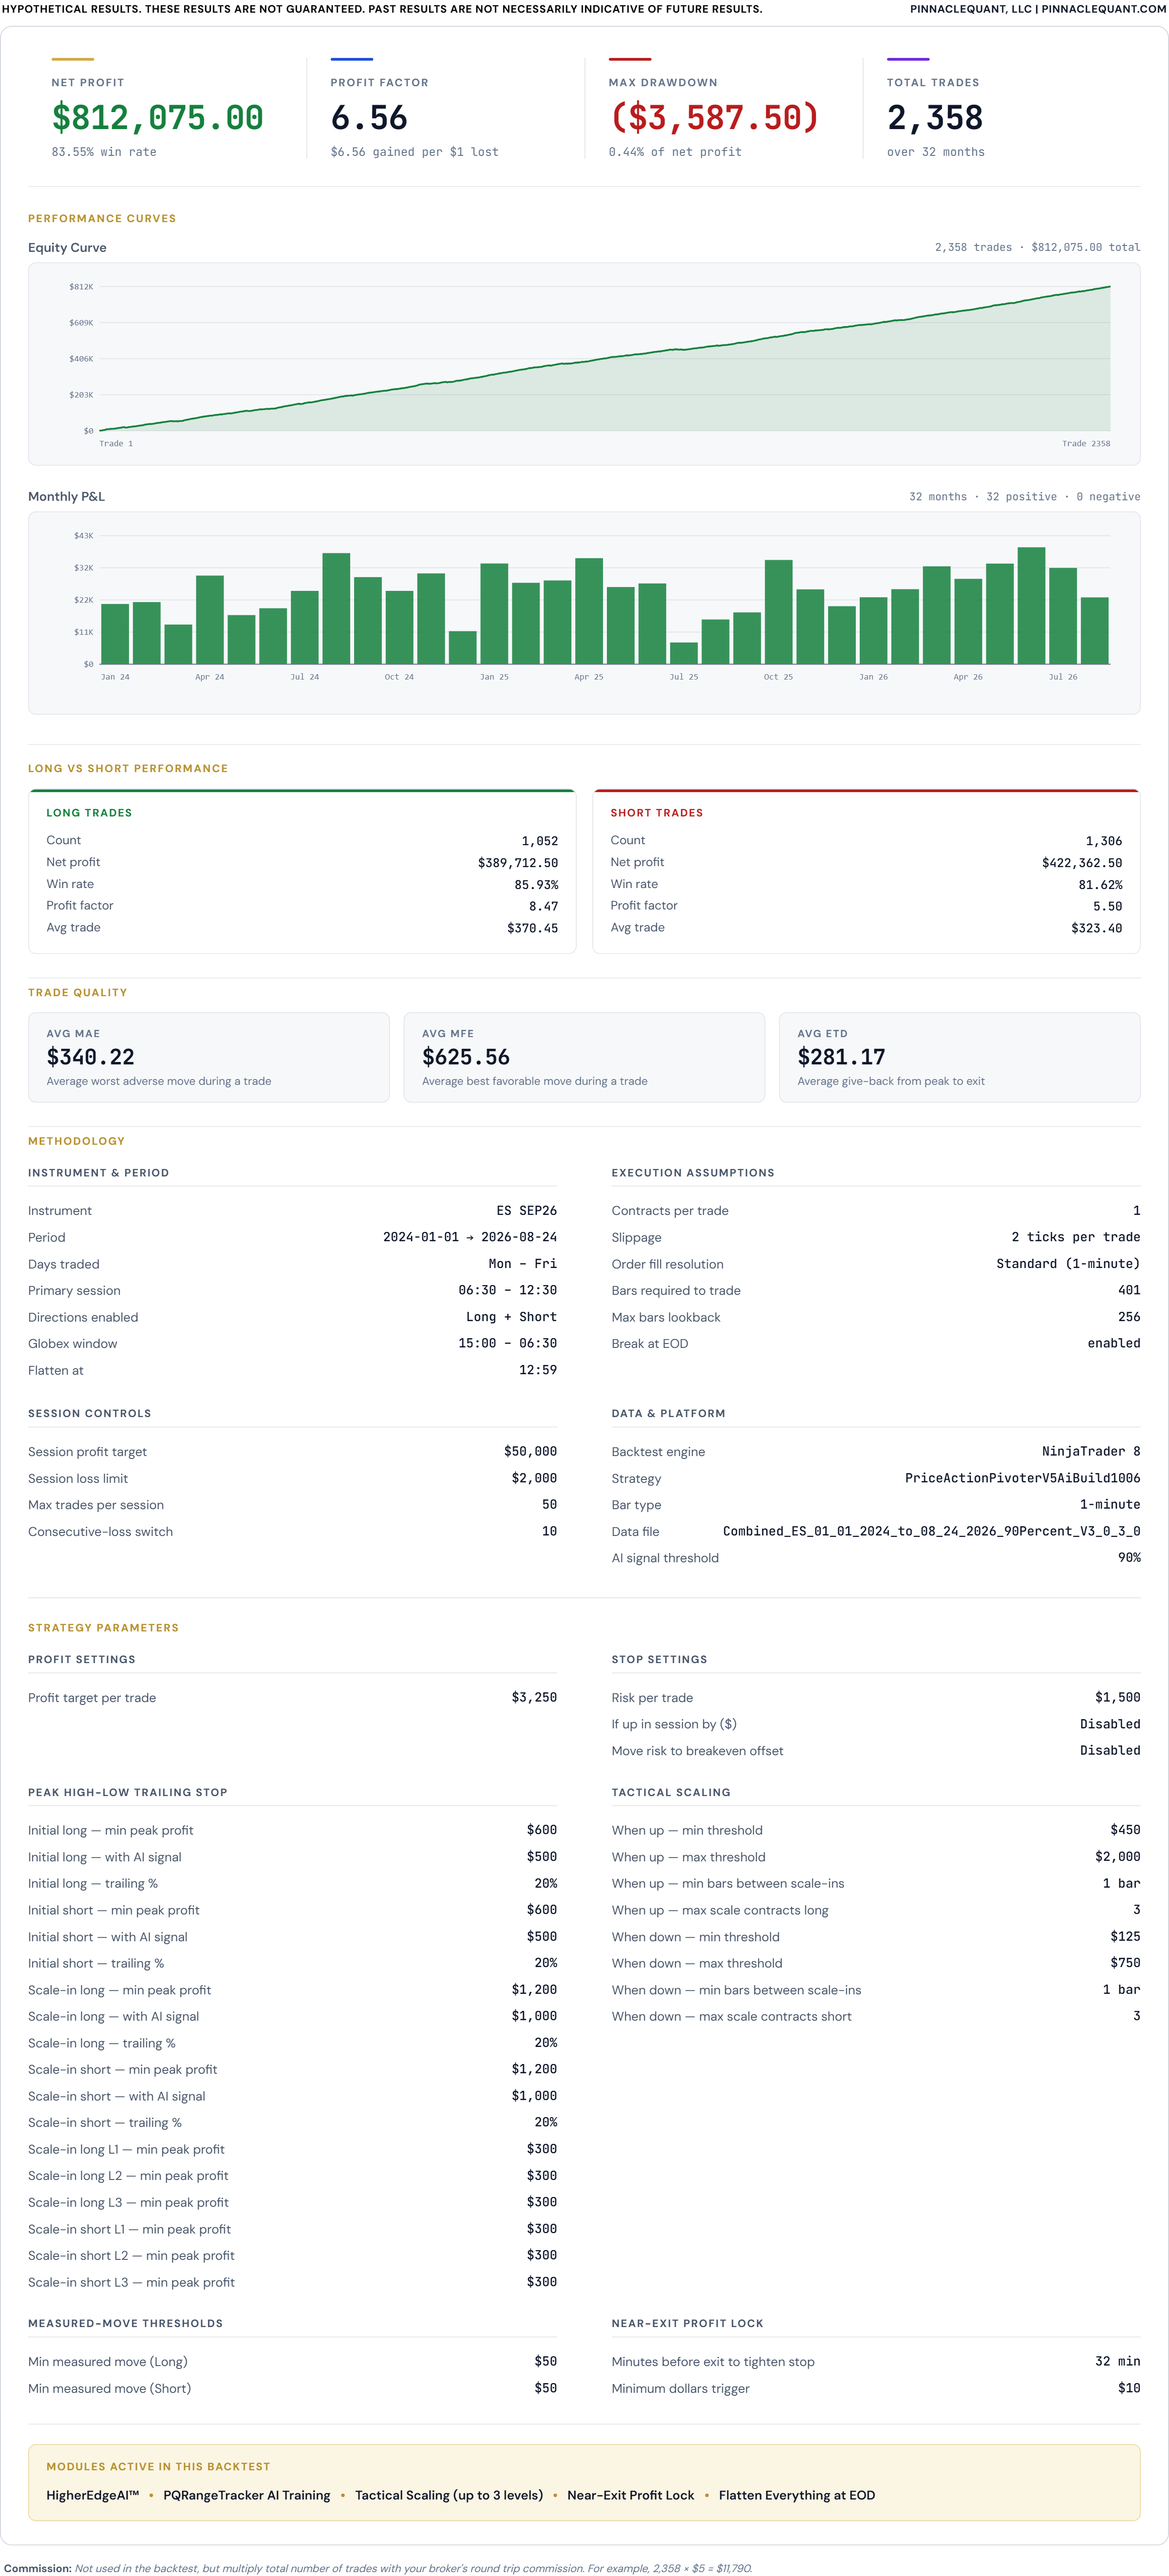
Hypothetical net profit$812,075.00

NinjaTrader Strategy Analyzer Summary, Backtest 3, ES 1 Contract 90%NinjaTrader Strategy Analyzer Monthly, Backtest 3, ES 1 Contract 90%NinjaTrader Strategy Analyzer Yearly, Backtest 3, ES 1 Contract 90%

NinjaTrader trade details, Backtest 3
Net profit$812,075.00
Gross profit$958,200.00
Gross loss($146,125.00)
Profit factor6.56
Max drawdown($3,587.50)
Number of trades2,358
Win rate83.55%
Winning trades1,970
Losing trades344
Start date1/1/2024
End date8/24/2026
Hours traded6:30 AM – 12:30 PM Pacific
Flatten everything12:59 PM Pacific
Sortino ratio1.00
Sharpe ratio2.12
Average time in market64.76 min
Max time to recover18.83 days
Longest flat period10.89 days
Average MAE$340.22
Average MFE$625.56
Market conditionAll, incl. economic news events
Contracts1
Slippage2 ticks
CommissionNot included; e.g. $5 × 2,358 = $11,790
Backtest 4 · NinjaTrader Strategy AnalyzerES · 2 Contracts · 90% HigherEdgeAI™ 3.0 Confidence Threshold
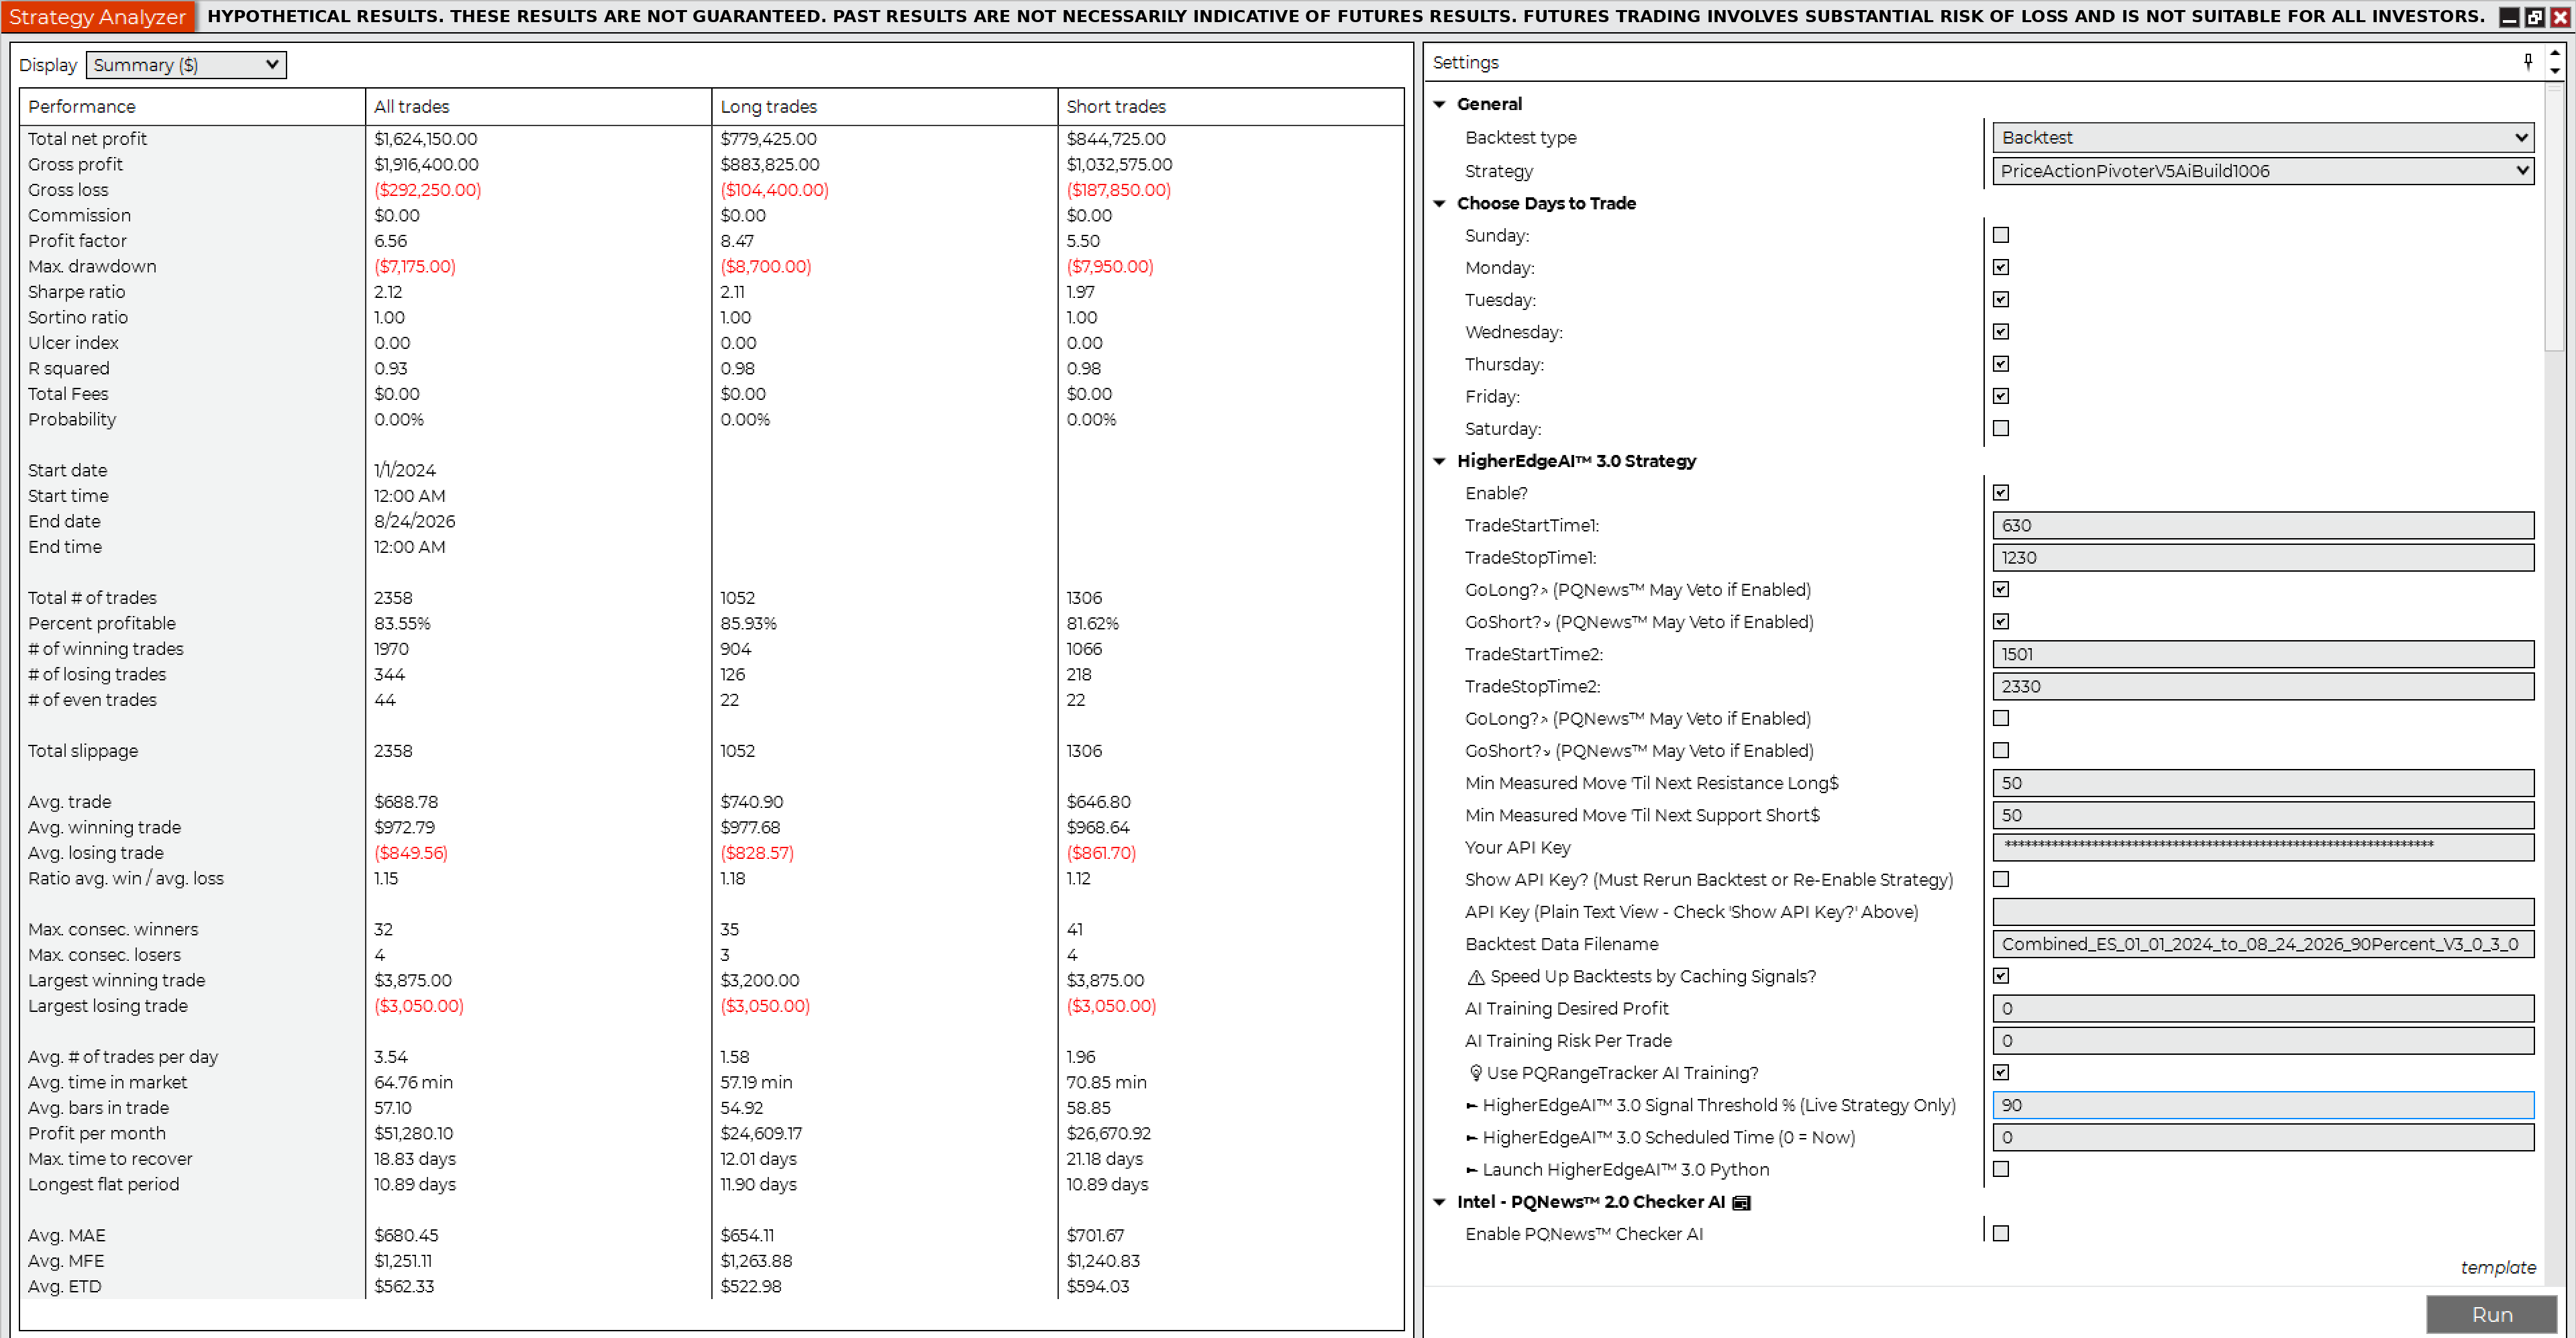
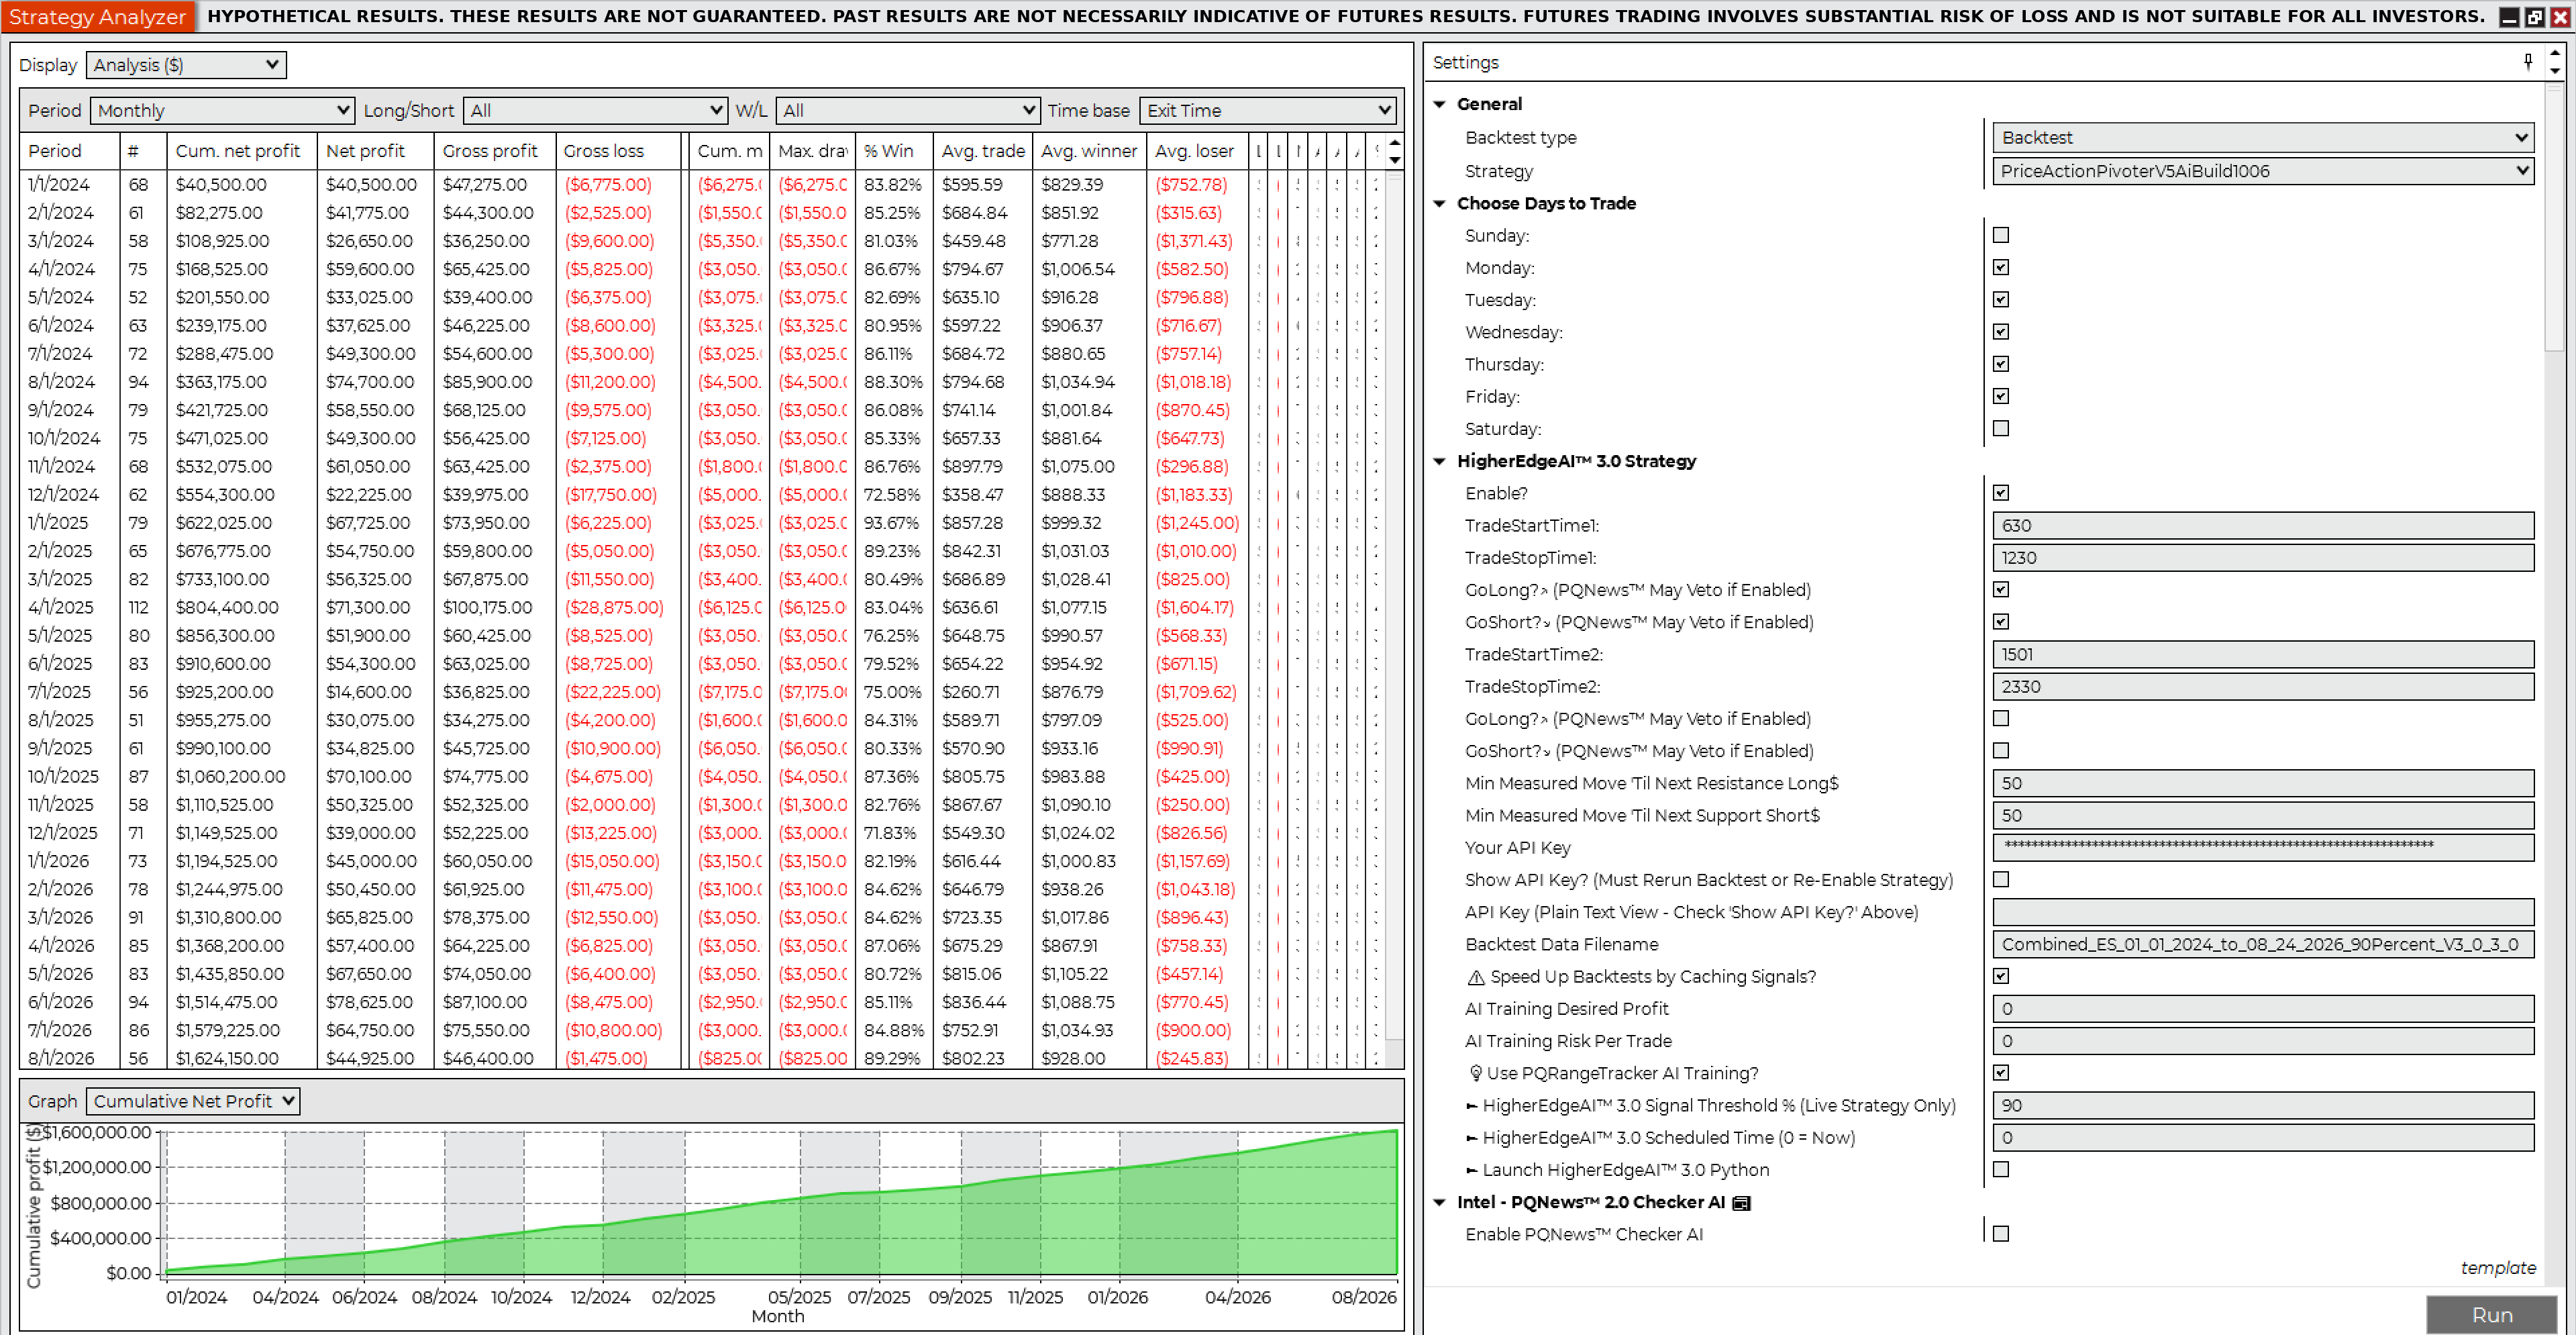
Hypothetical net profit$1,624,150.00

NinjaTrader Strategy Analyzer Summary, Backtest 4, ES 2 Contracts 90%NinjaTrader Strategy Analyzer Monthly, Backtest 4, ES 2 Contracts 90%NinjaTrader Strategy Analyzer Yearly, Backtest 4, ES 2 Contracts 90%

NinjaTrader trade details, Backtest 4
Net profit$1,624,150.00
Gross profit$1,916,400.00
Gross loss($292,250.00)
Profit factor6.56
Max drawdown($7,175.00)
Number of trades2,358
Win rate83.55%
Winning trades1,970
Losing trades344
Start date1/1/2024
End date8/24/2026
Hours traded6:30 AM – 12:30 PM Pacific
Flatten everything12:59 PM Pacific
Sortino ratio1.00
Sharpe ratio2.12
Average time in market64.76 min
Max time to recover18.83 days
Longest flat period10.89 days
Average MAE$680.45
Average MFE$1,251.11
Market conditionAll, incl. economic news events
Contracts2
Slippage2 ticks
CommissionNot included; e.g. $10 × 2,358 = $23,580
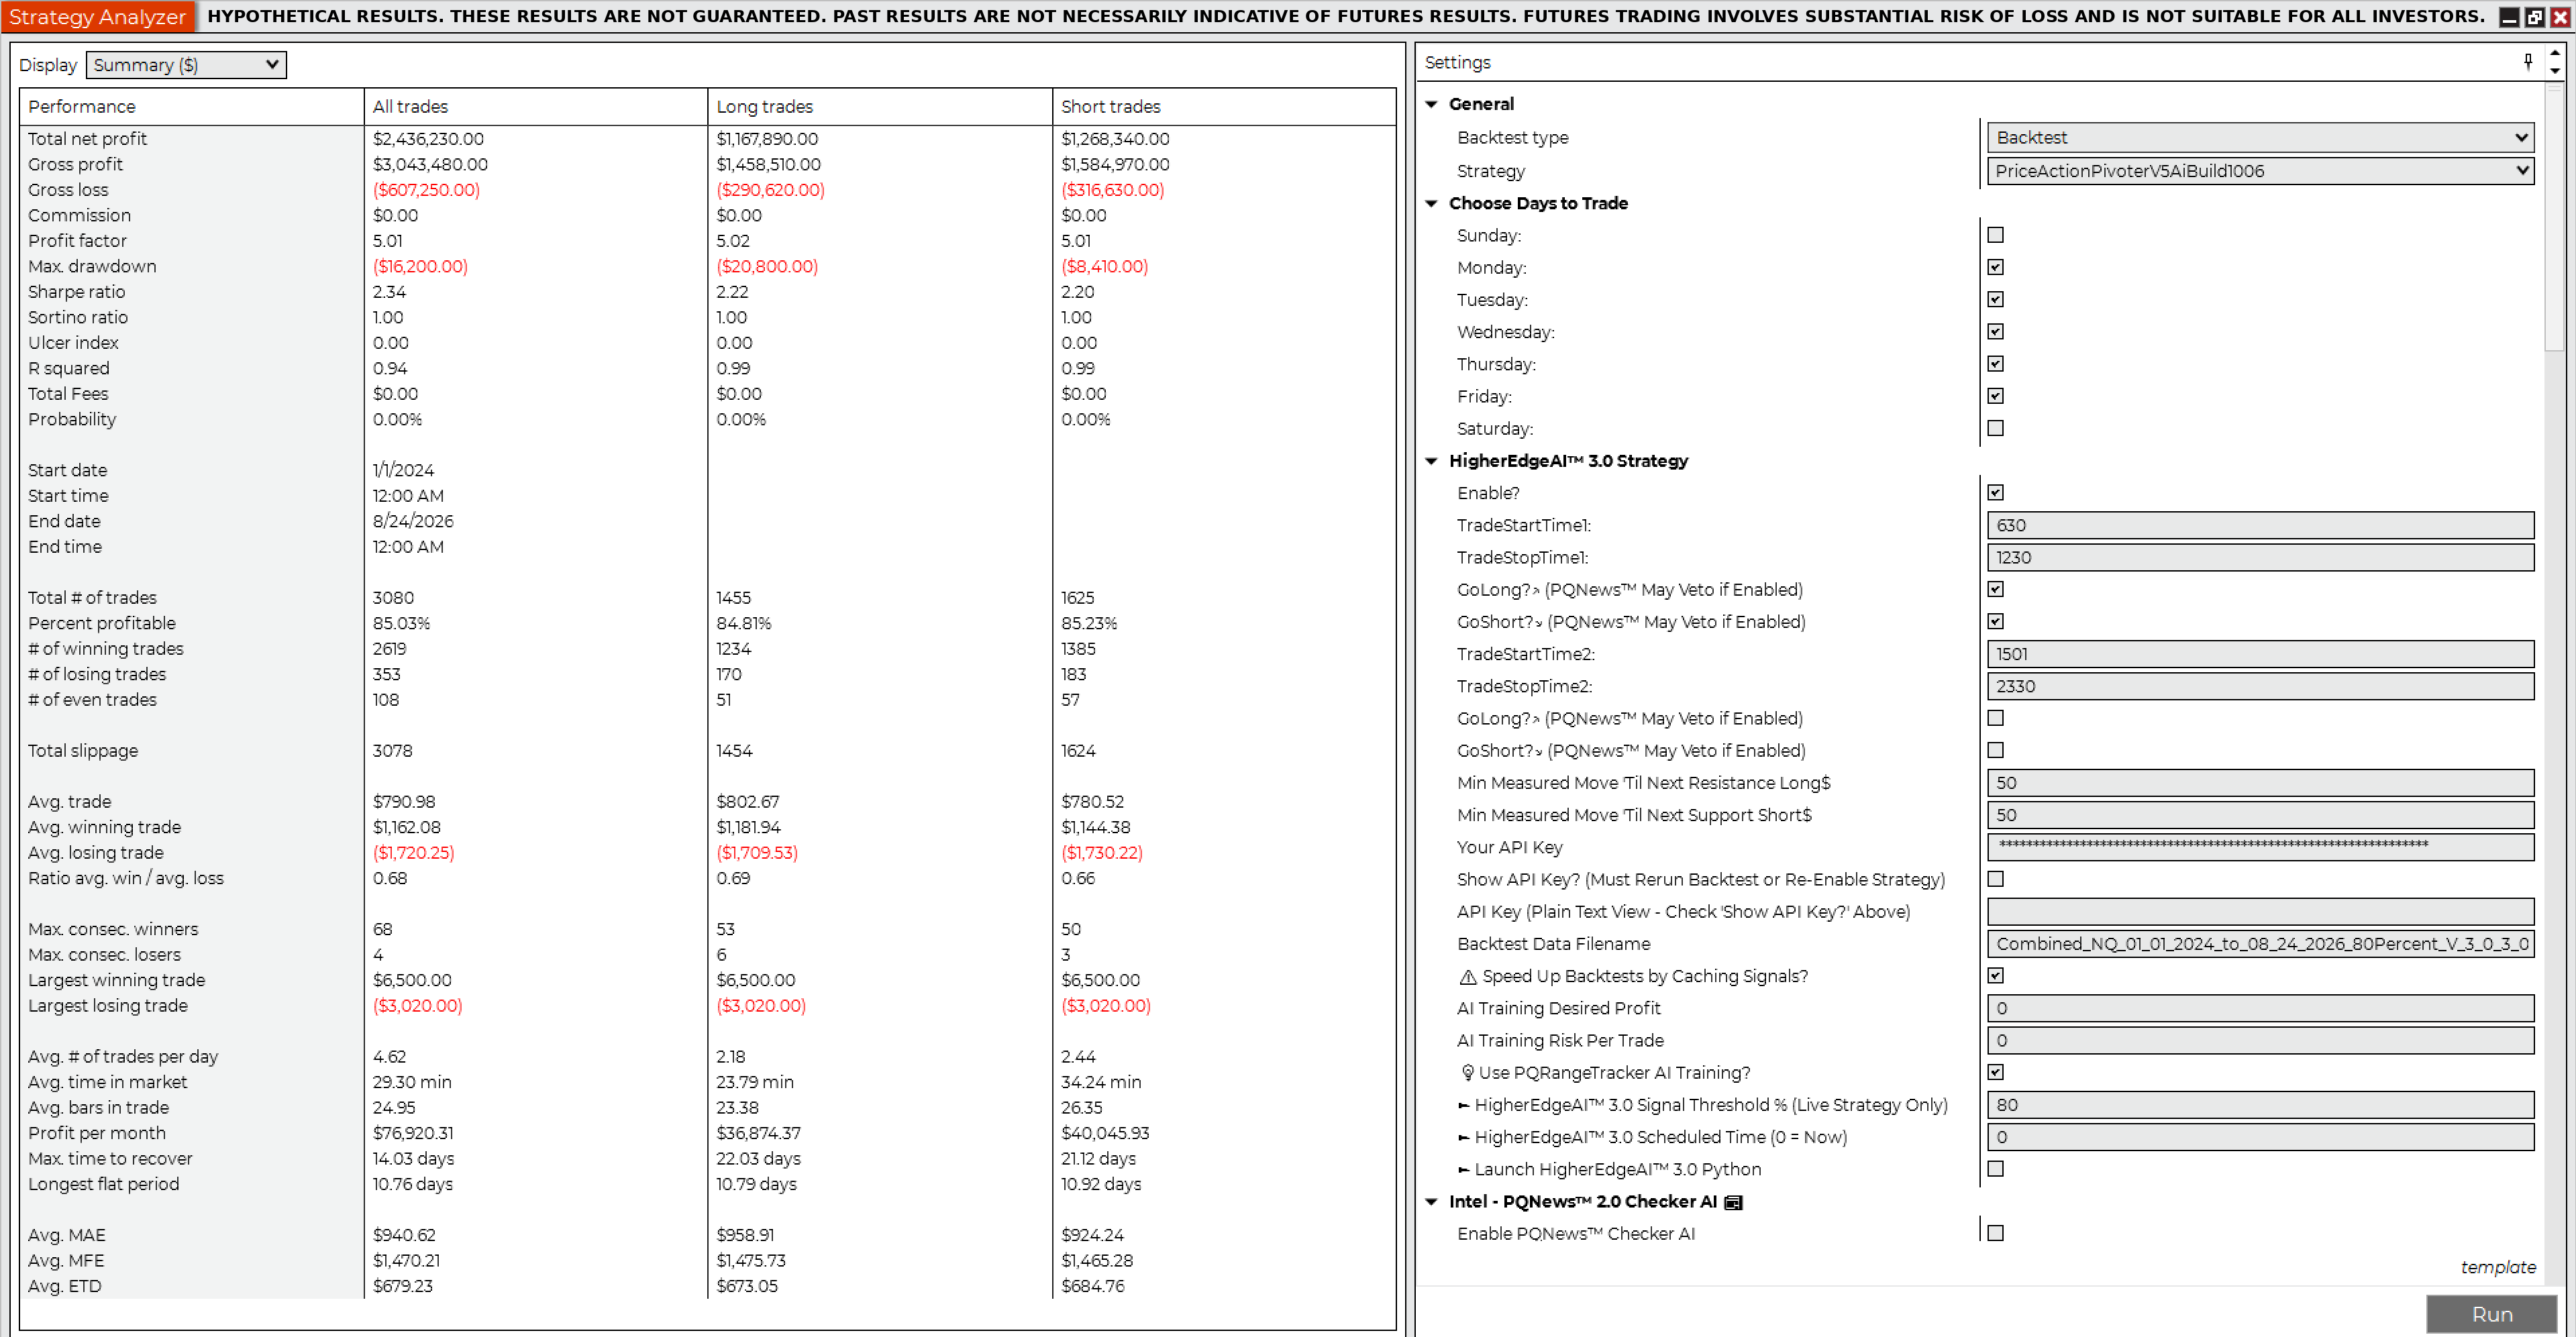
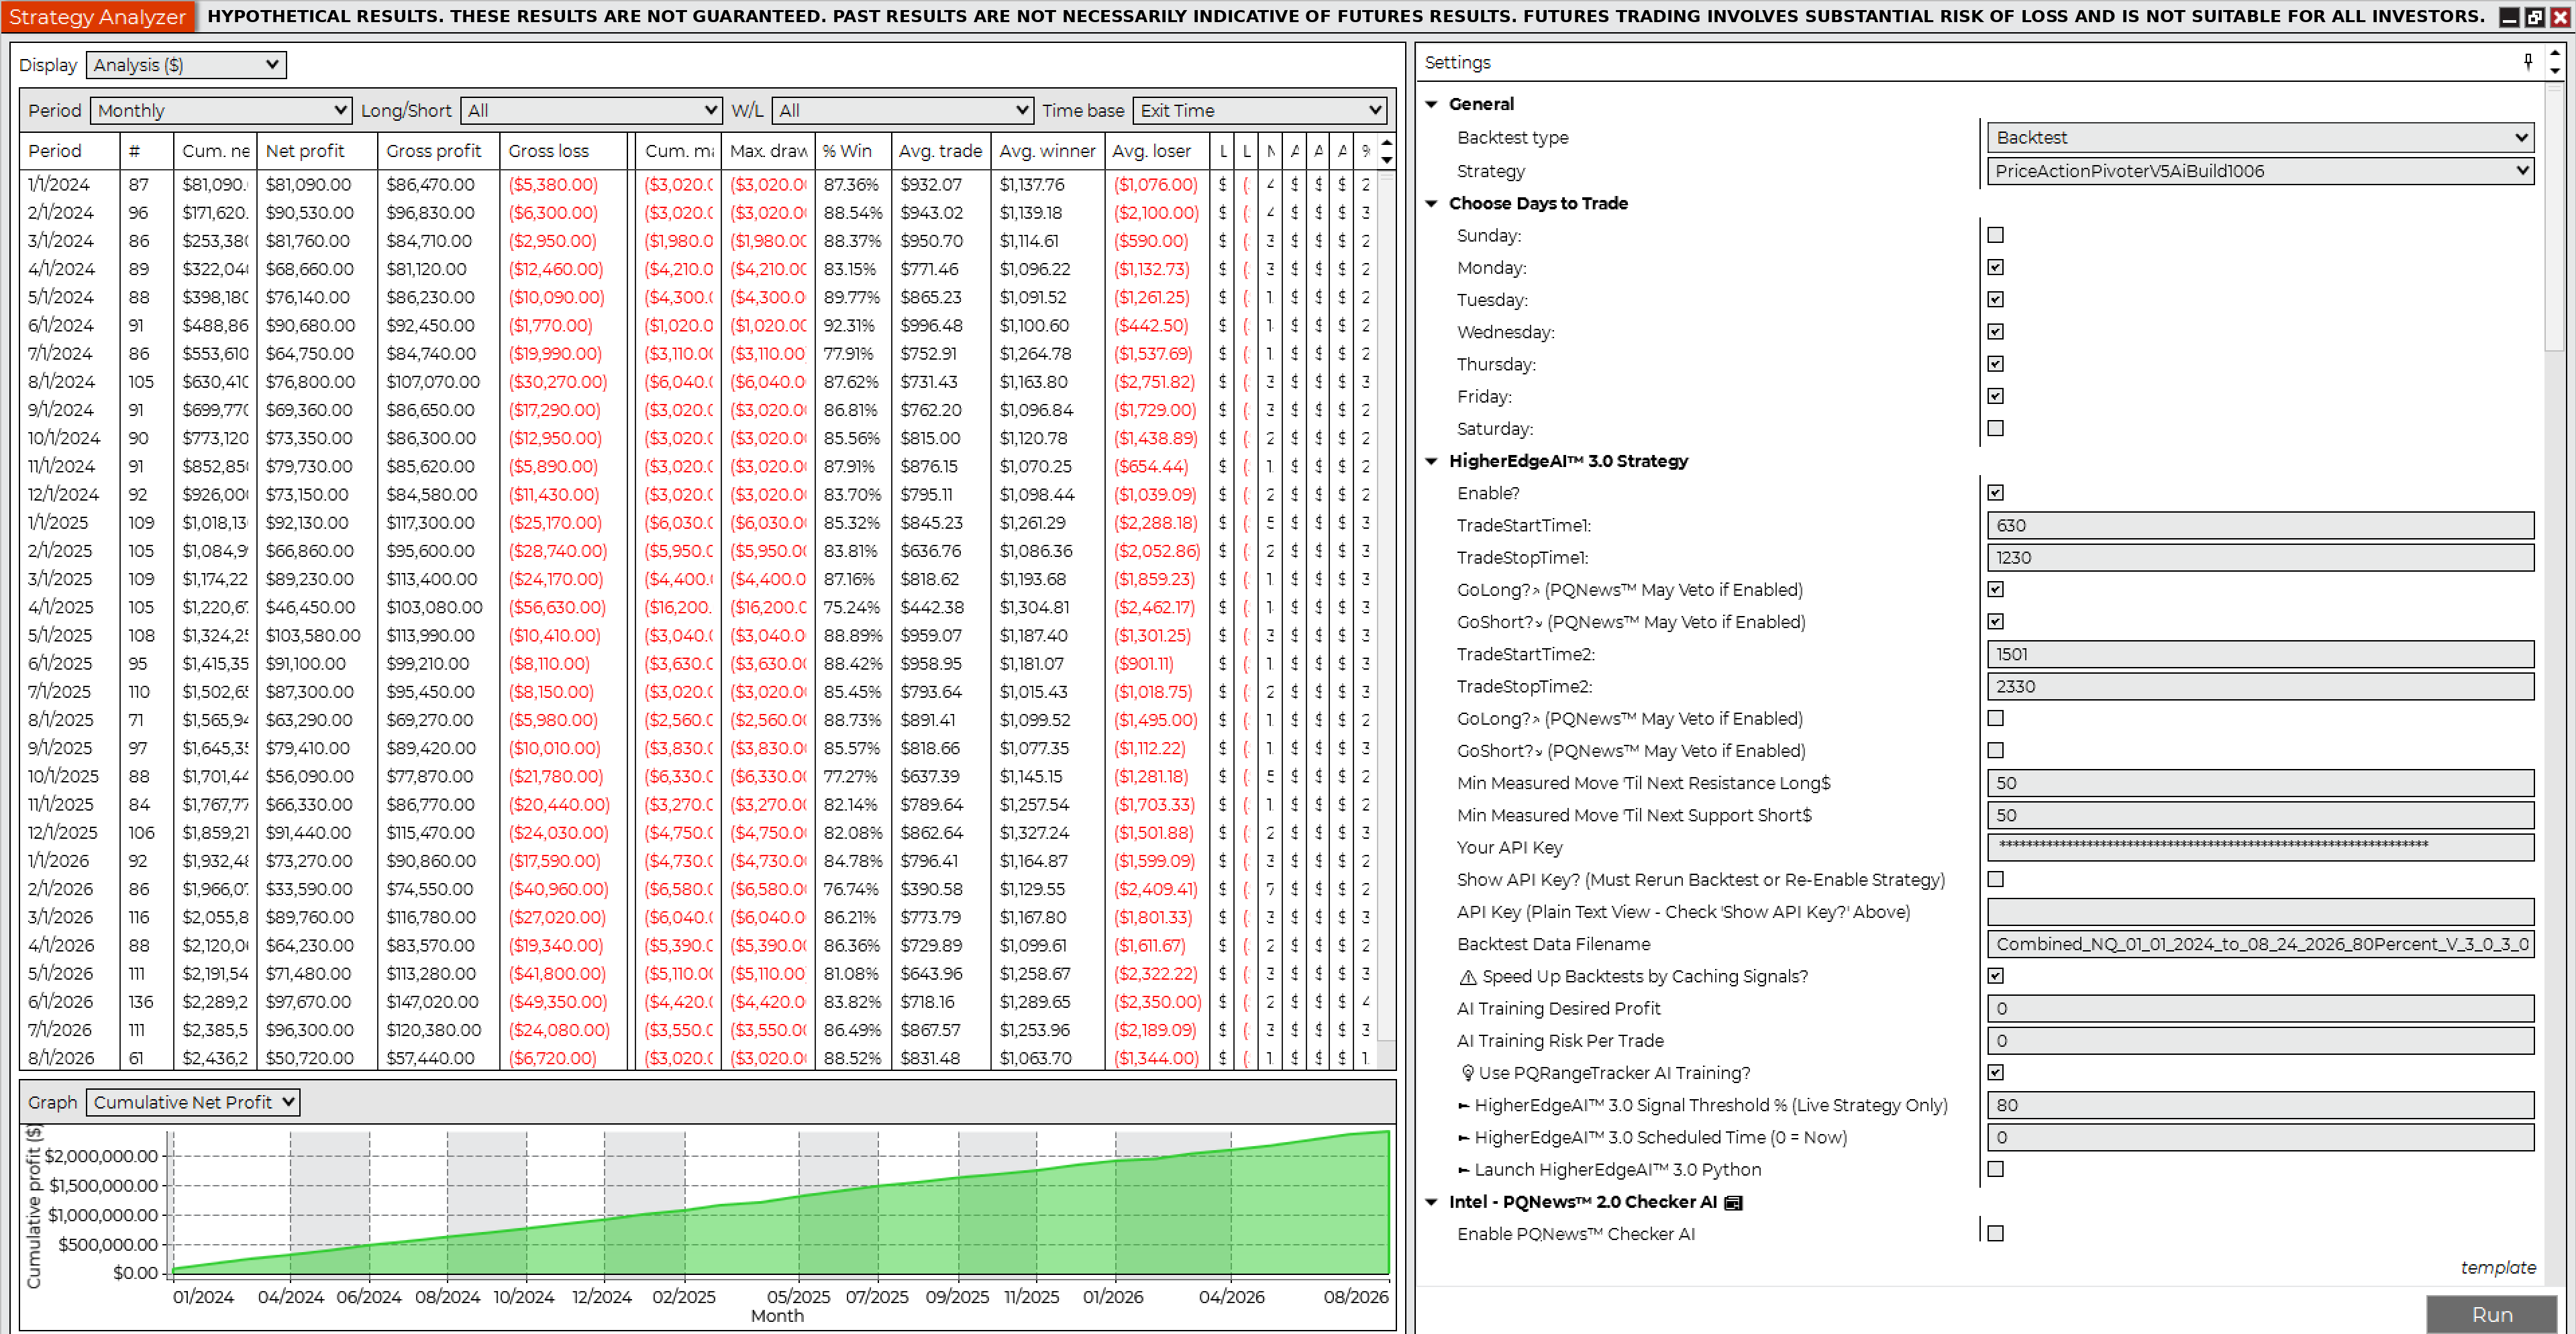
Backtest 5 · NinjaTrader Strategy AnalyzerNQ · 1 Contract · 80% HigherEdgeAI™ 3.0 Confidence Threshold
Hypothetical net profit$1,218,115.00

NinjaTrader Strategy Analyzer Summary, Backtest 5, NQ 1 Contract 80%NinjaTrader Strategy Analyzer Monthly, Backtest 5, NQ 1 Contract 80%NinjaTrader Strategy Analyzer Yearly, Backtest 5, NQ 1 Contract 80%

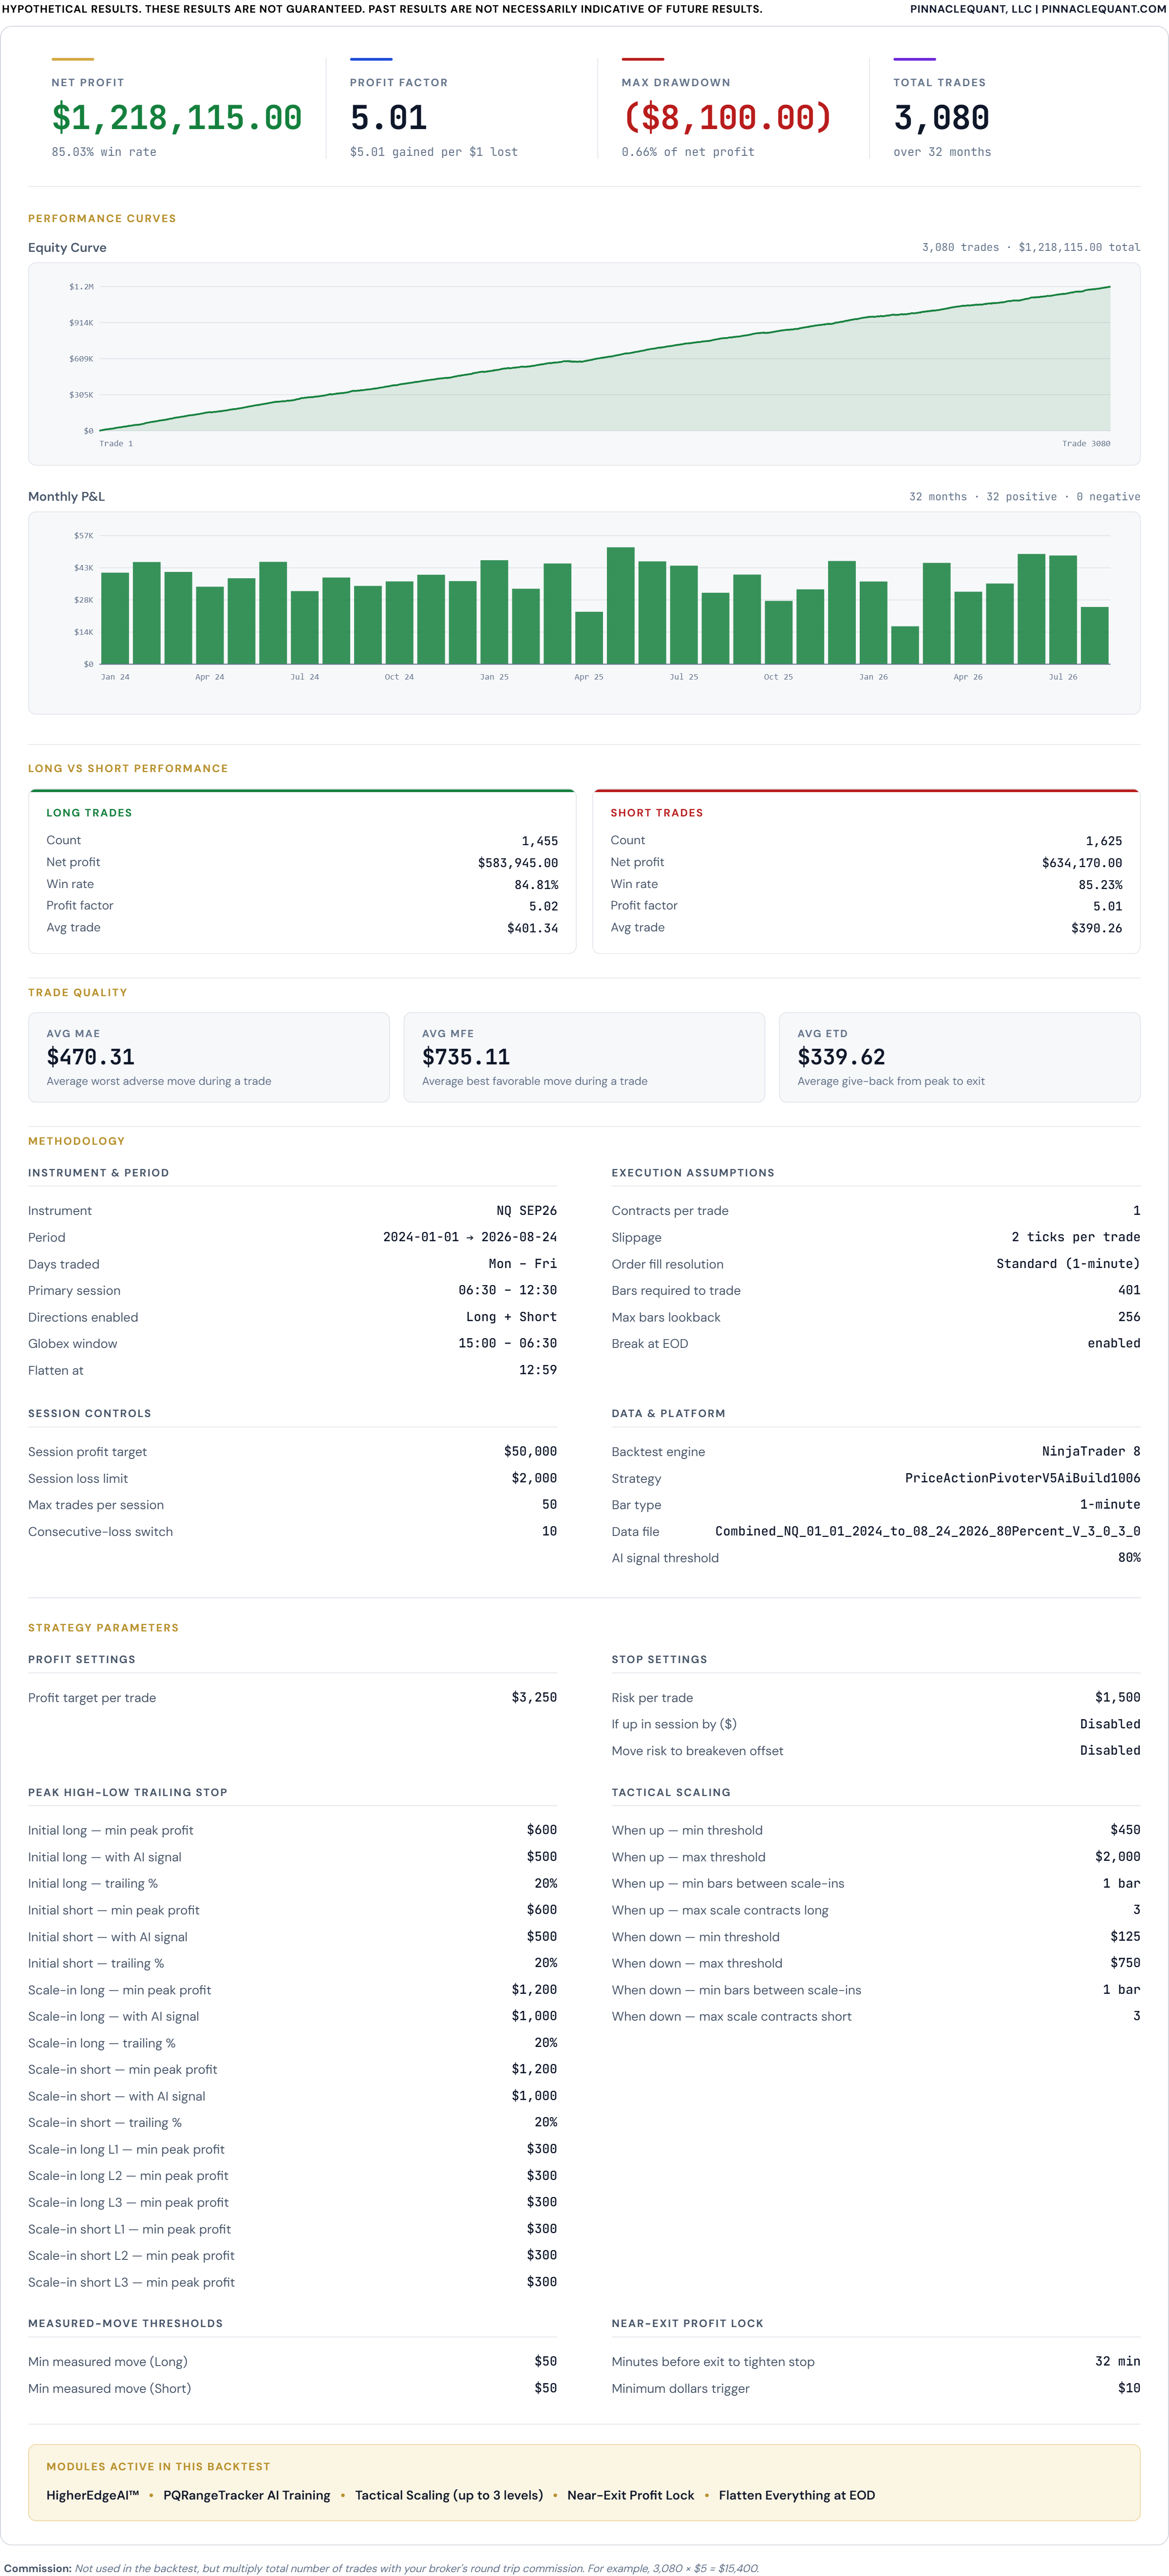
NinjaTrader trade details, Backtest 5
Net profit$1,218,115.00
Gross profit$1,521,740.00
Gross loss($303,625.00)
Profit factor5.01
Max drawdown($8,100.00)
Number of trades3,080
Win rate85.03%
Winning trades2,619
Losing trades353
Start date1/1/2024
End date8/24/2026
Hours traded6:30 AM – 12:30 PM Pacific
Flatten everything12:59 PM Pacific
Sortino ratio1.00
Sharpe ratio2.34
Average time in market29.30 min
Max time to recover14.03 days
Longest flat period10.76 days
Average MAE$470.31
Average MFE$735.11
Market conditionAll, incl. economic news events
Contracts1
Slippage2 ticks
CommissionNot included; e.g. $5 × 3,080 = $15,400
Backtest 6 · NinjaTrader Strategy AnalyzerNQ · 2 Contracts · 80% HigherEdgeAI™ 3.0 Confidence Threshold
Hypothetical net profit$2,436,230.00

NinjaTrader Strategy Analyzer Summary, Backtest 6, NQ 2 Contracts 80%NinjaTrader Strategy Analyzer Monthly, Backtest 6, NQ 2 Contracts 80%NinjaTrader Strategy Analyzer Yearly, Backtest 6, NQ 2 Contracts 80%

NinjaTrader trade details, Backtest 6
Net profit$2,436,230.00
Gross profit$3,043,480.00
Gross loss($607,250.00)
Profit factor5.01
Max drawdown($16,200.00)
Number of trades3,080
Win rate85.03%
Winning trades2,619
Losing trades353
Start date1/1/2024
End date8/24/2026
Hours traded6:30 AM – 12:30 PM Pacific
Flatten everything12:59 PM Pacific
Sortino ratio1.00
Sharpe ratio2.34
Average time in market29.30 min
Max time to recover14.03 days
Longest flat period10.76 days
Average MAE$940.62
Average MFE$1,470.21
Market conditionAll, incl. economic news events
Contracts2
Slippage2 ticks
CommissionNot included; e.g. $10 × 3,080 = $30,800
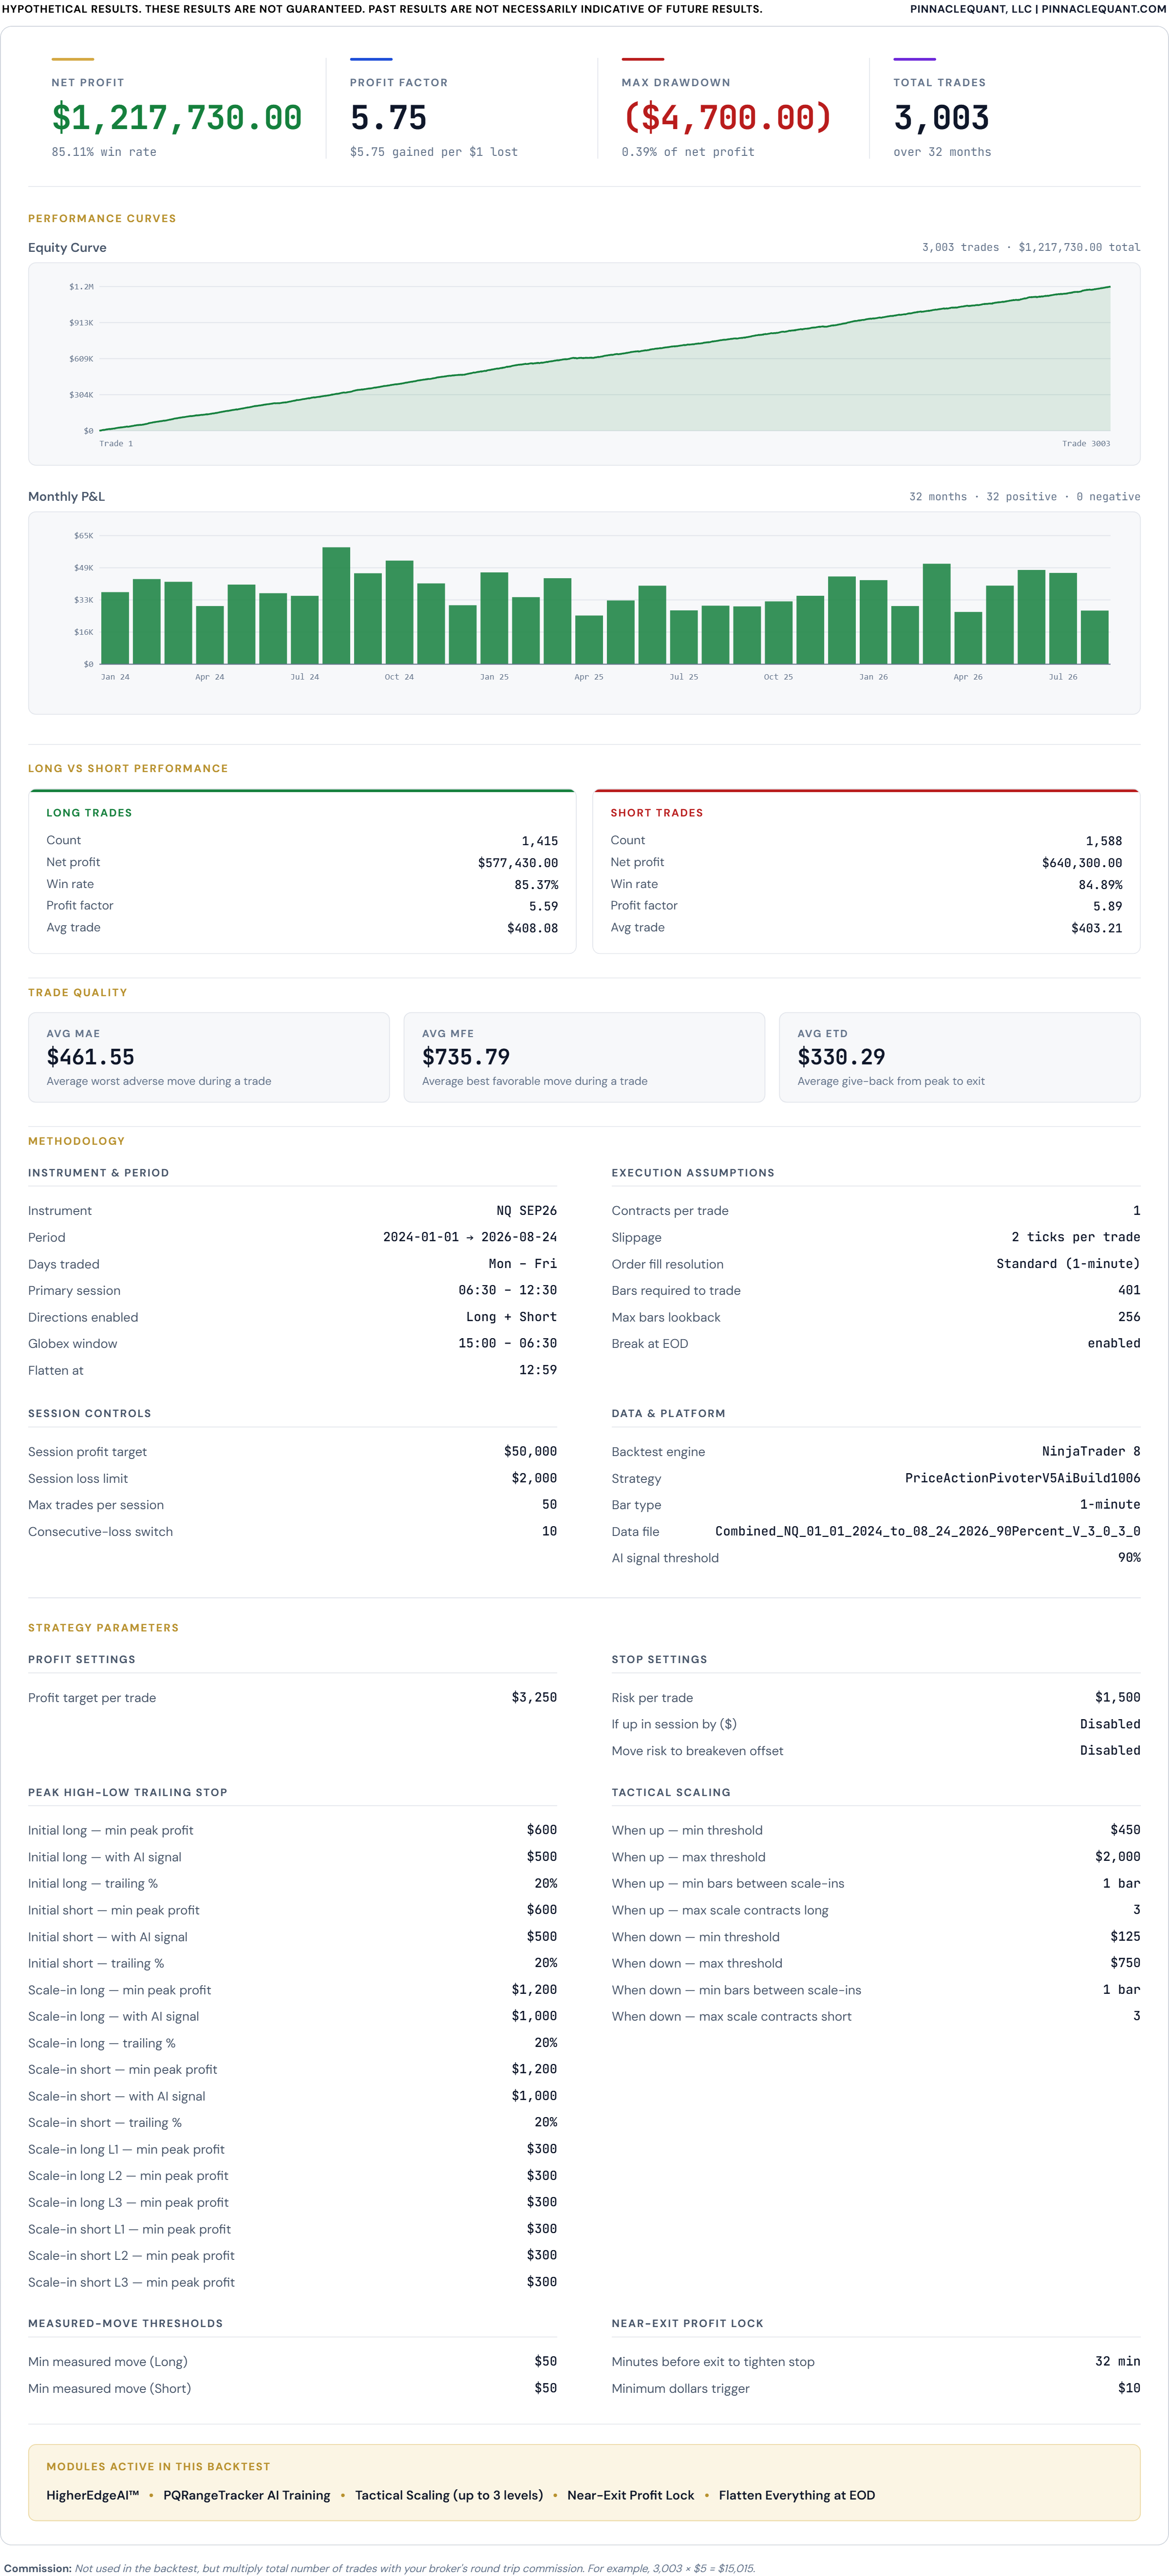
Backtest 7 · NinjaTrader Strategy AnalyzerNQ · 1 Contract · 90% HigherEdgeAI™ 3.0 Confidence Threshold
Hypothetical net profit$1,217,730.00

NinjaTrader Strategy Analyzer Summary, Backtest 7, NQ 1 Contract 90%NinjaTrader Strategy Analyzer Monthly, Backtest 7, NQ 1 Contract 90%NinjaTrader Strategy Analyzer Yearly, Backtest 7, NQ 1 Contract 90%

NinjaTrader trade details, Backtest 7
Net profit$1,217,730.00
Gross profit$1,474,325.00
Gross loss($256,595.00)
Profit factor5.75
Max drawdown($4,700.00)
Number of trades3,003
Win rate85.11%
Winning trades2,556
Losing trades321
Start date1/1/2024
End date8/24/2026
Hours traded6:30 AM – 12:30 PM Pacific
Flatten everything12:59 PM Pacific
Sortino ratio1.00
Sharpe ratio2.25
Average time in market30.56 min
Max time to recover6.82 days
Longest flat period10.77 days
Average MAE$461.55
Average MFE$735.79
Market conditionAll, incl. economic news events
Contracts1
Slippage2 ticks
CommissionNot included; e.g. $5 × 3,003 = $15,015
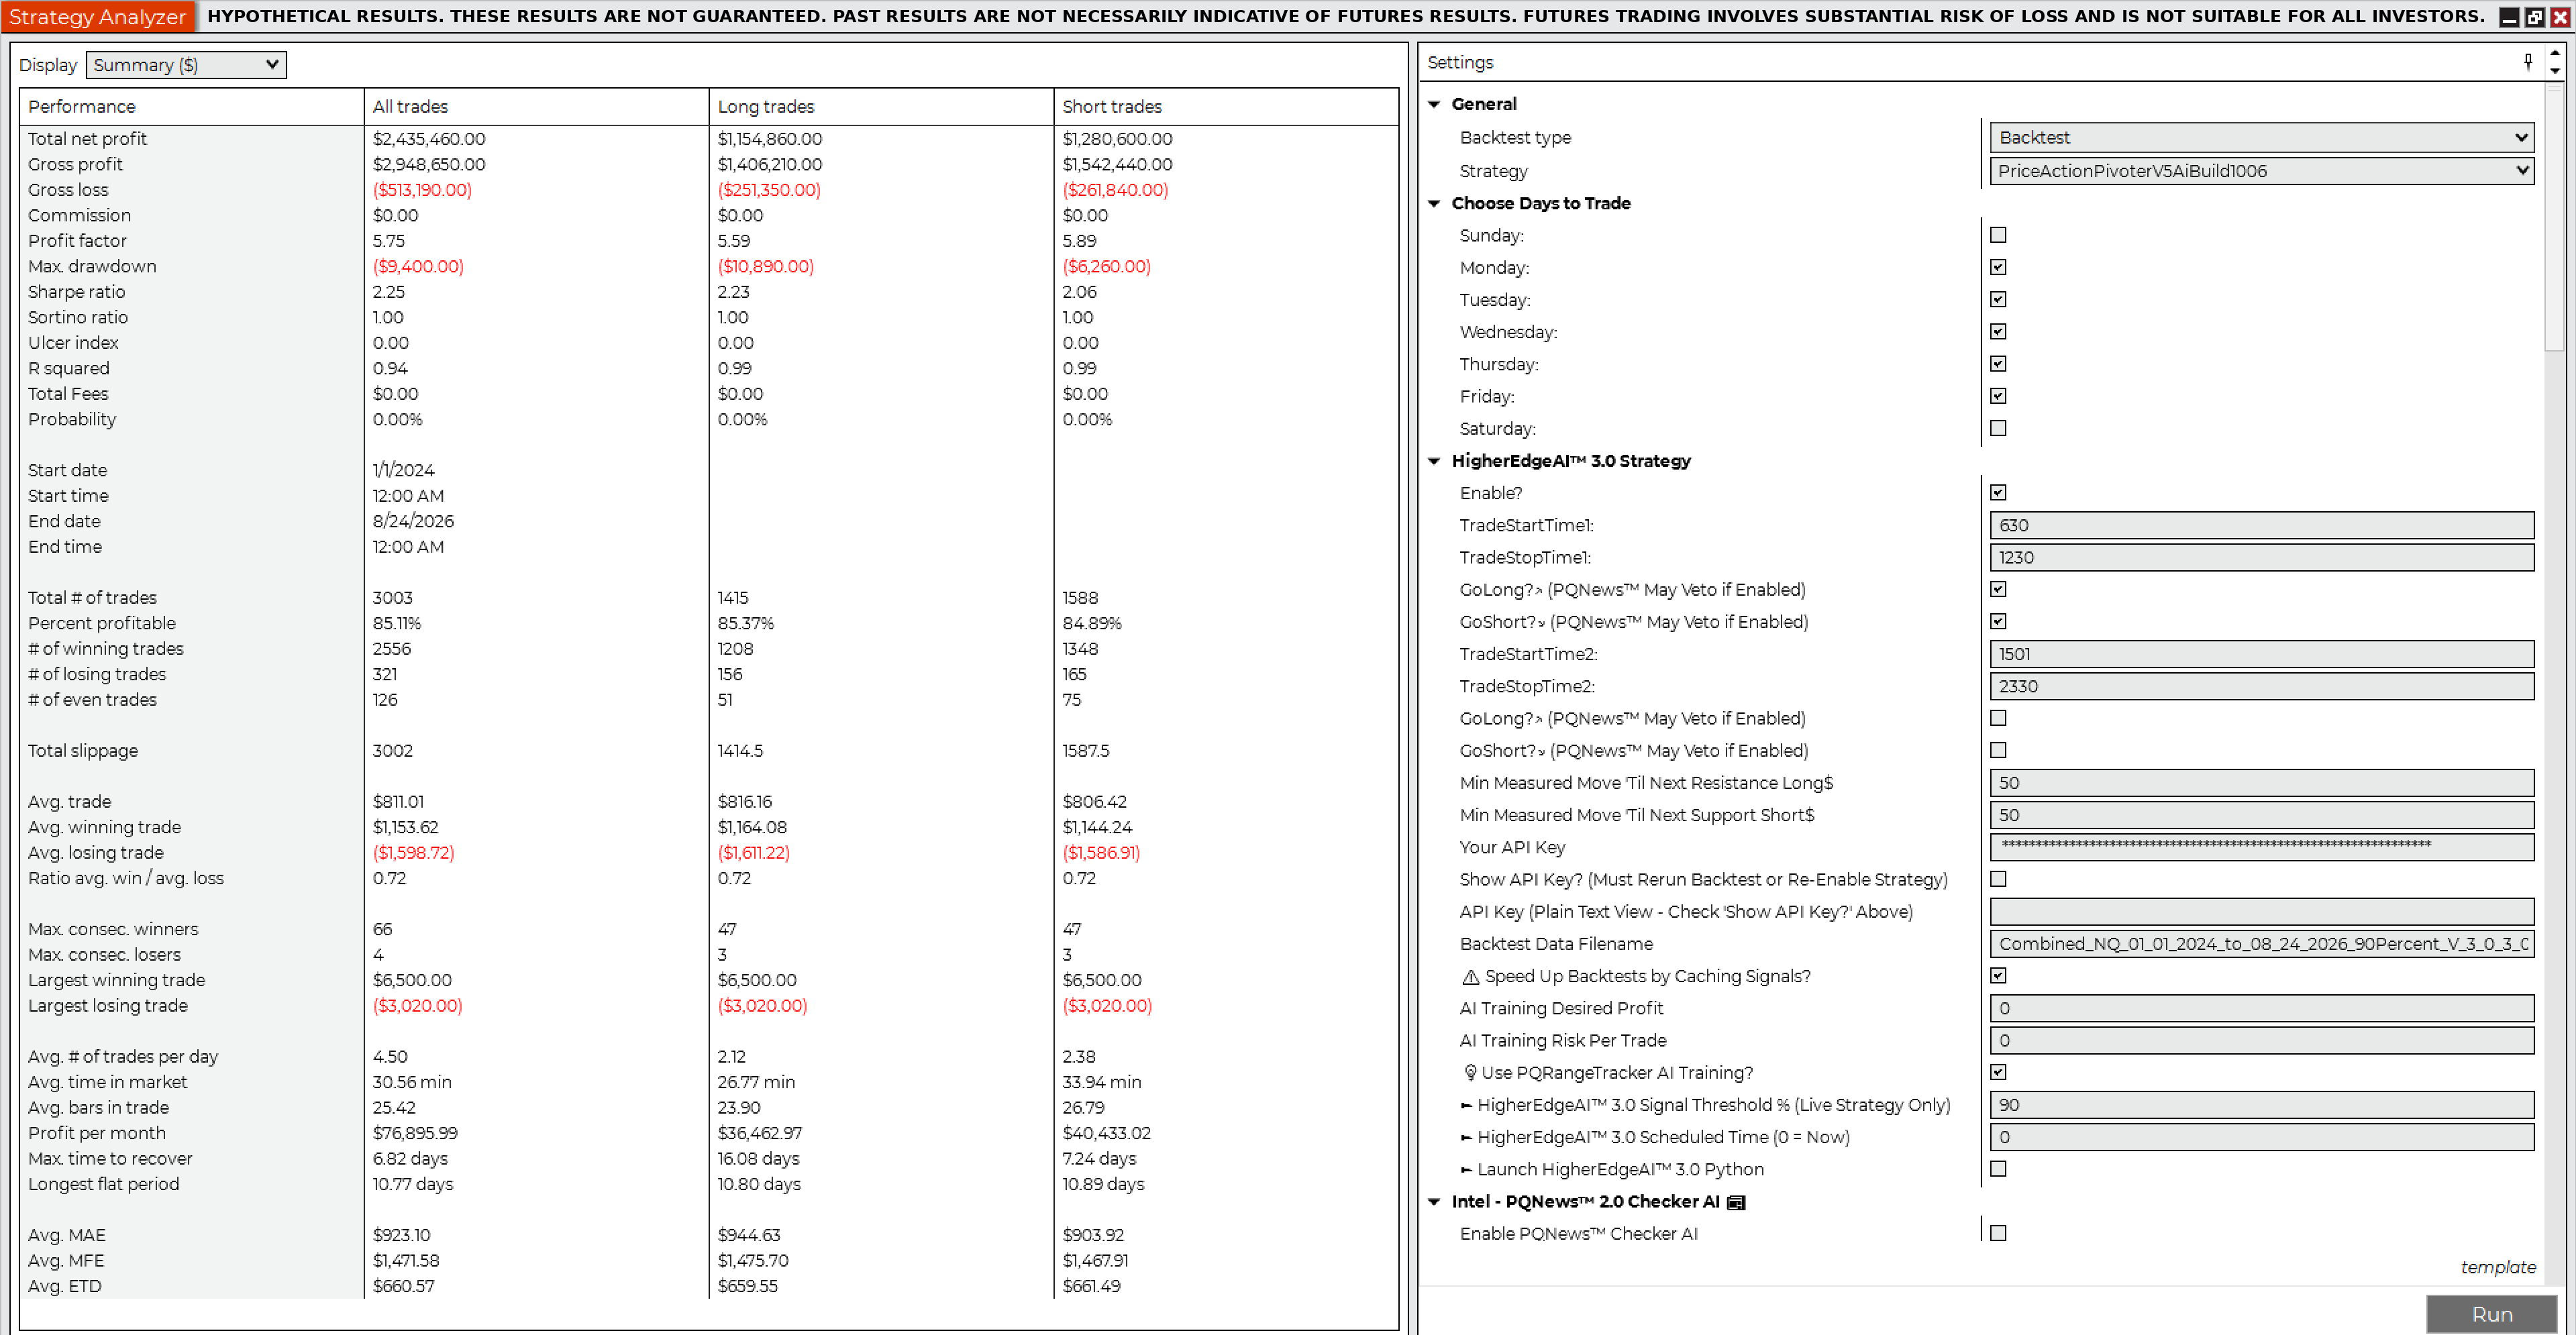
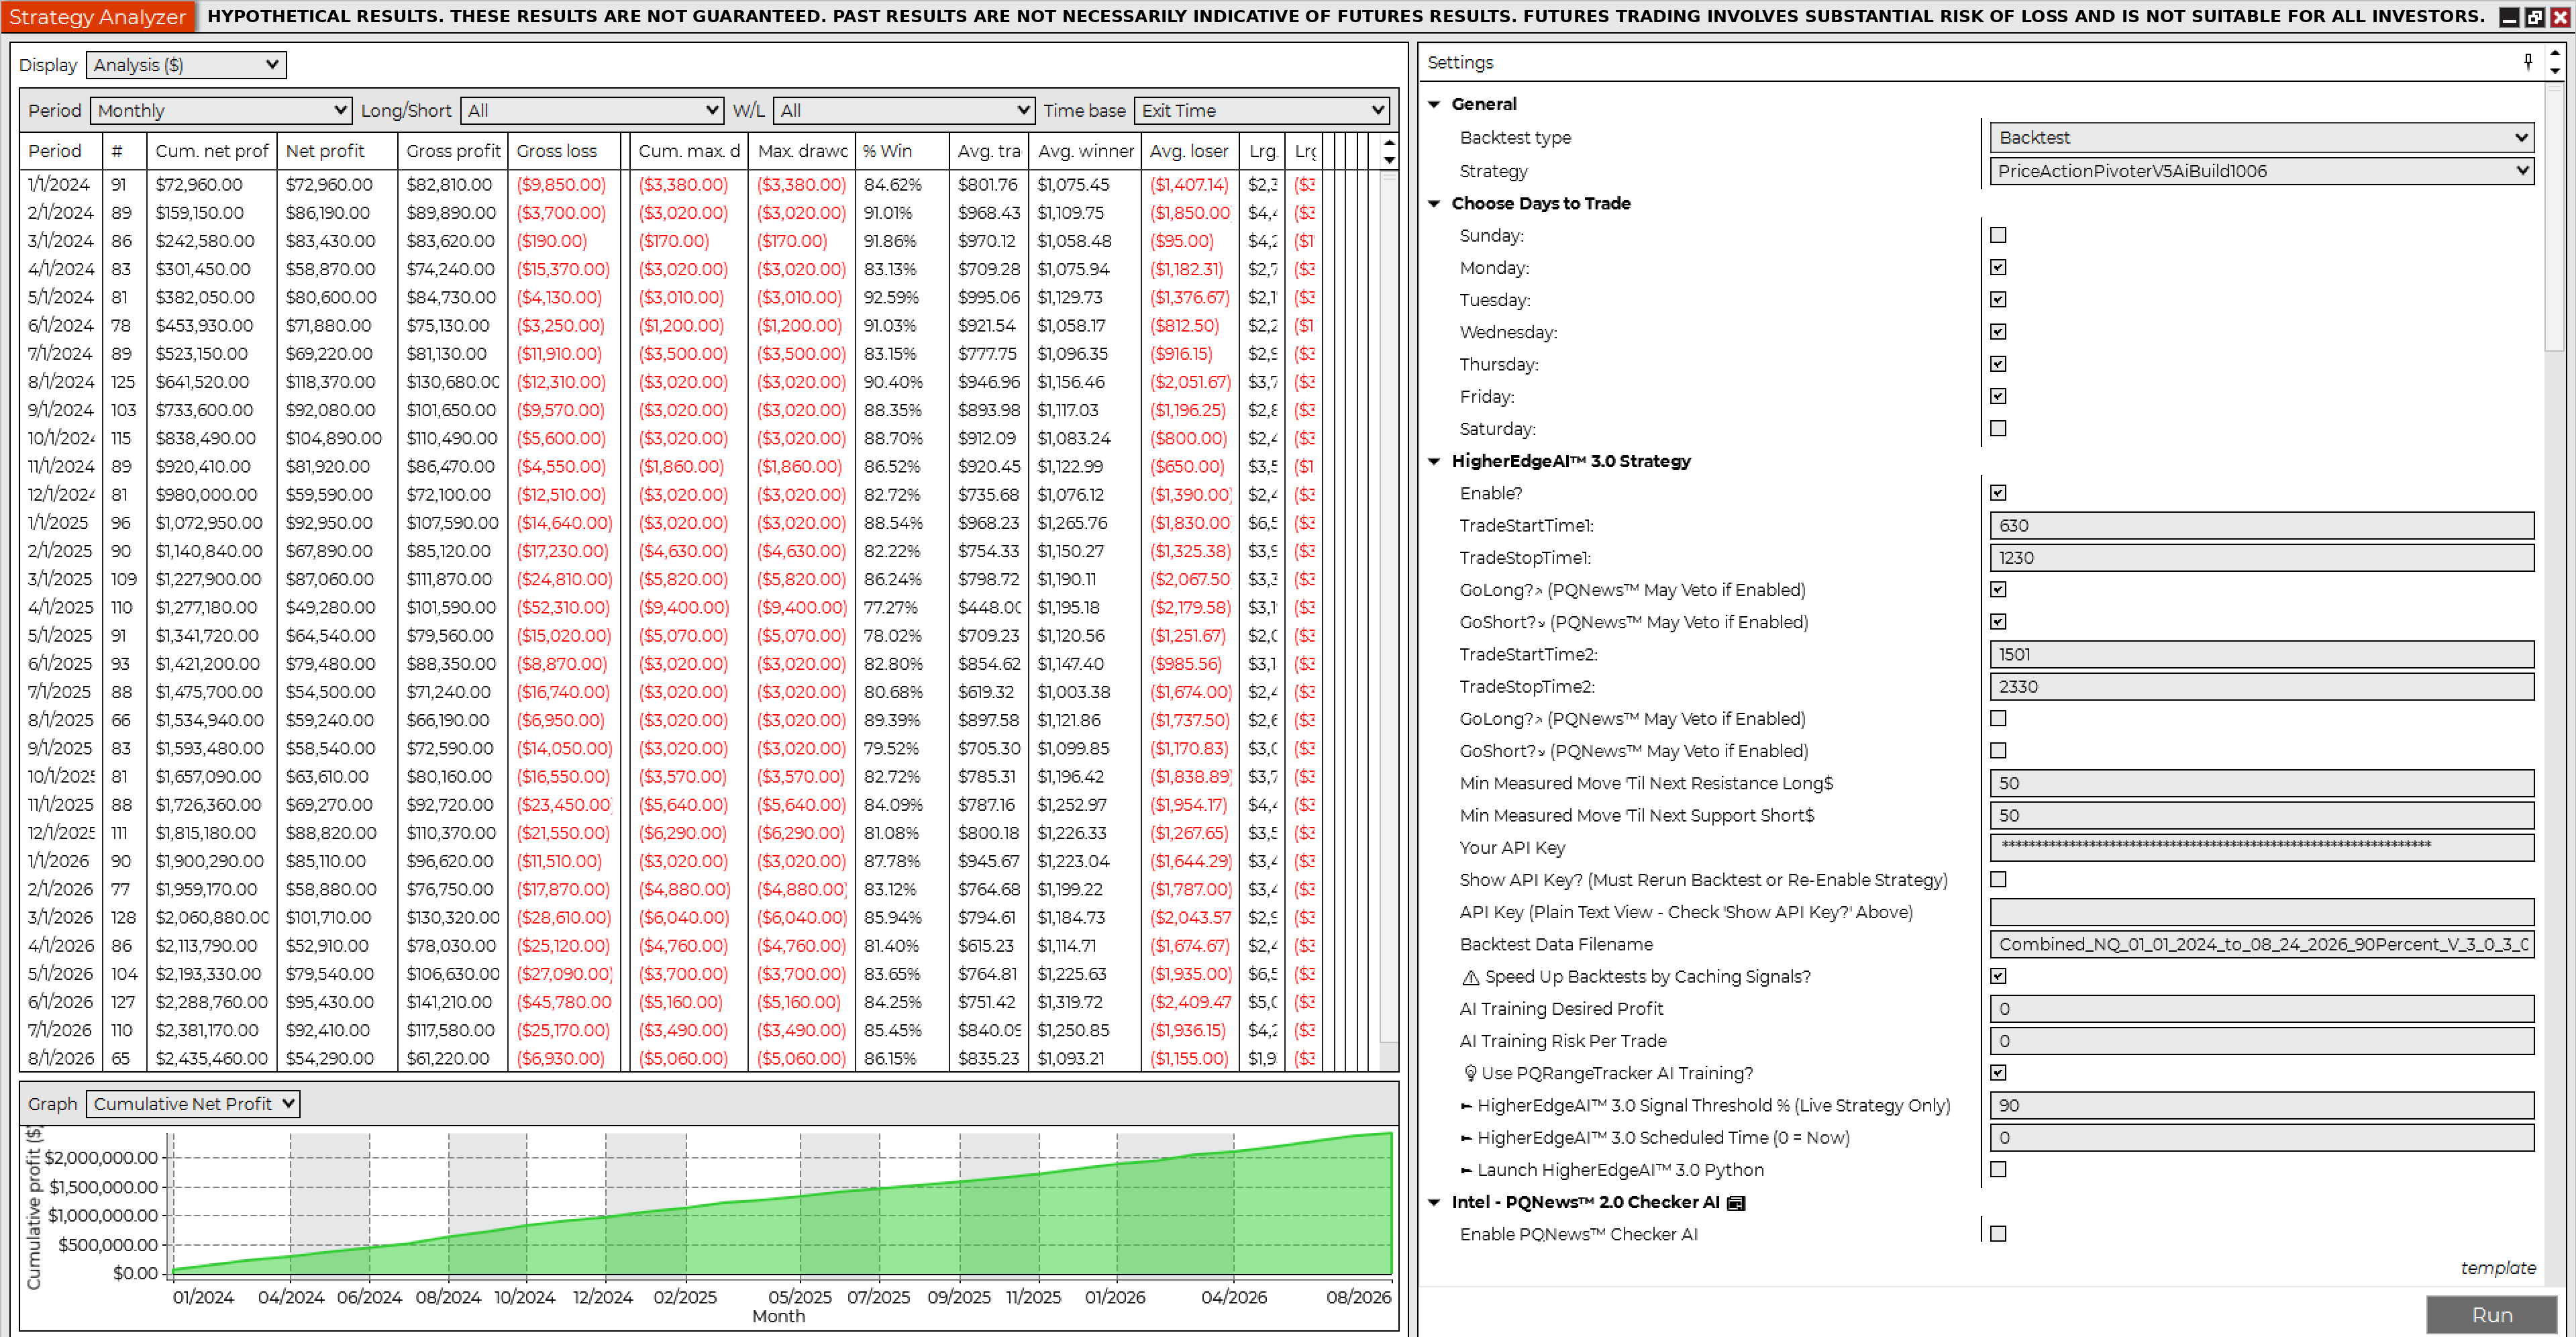
Backtest 8 · NinjaTrader Strategy AnalyzerNQ · 2 Contracts · 90% HigherEdgeAI™ 3.0 Confidence Threshold
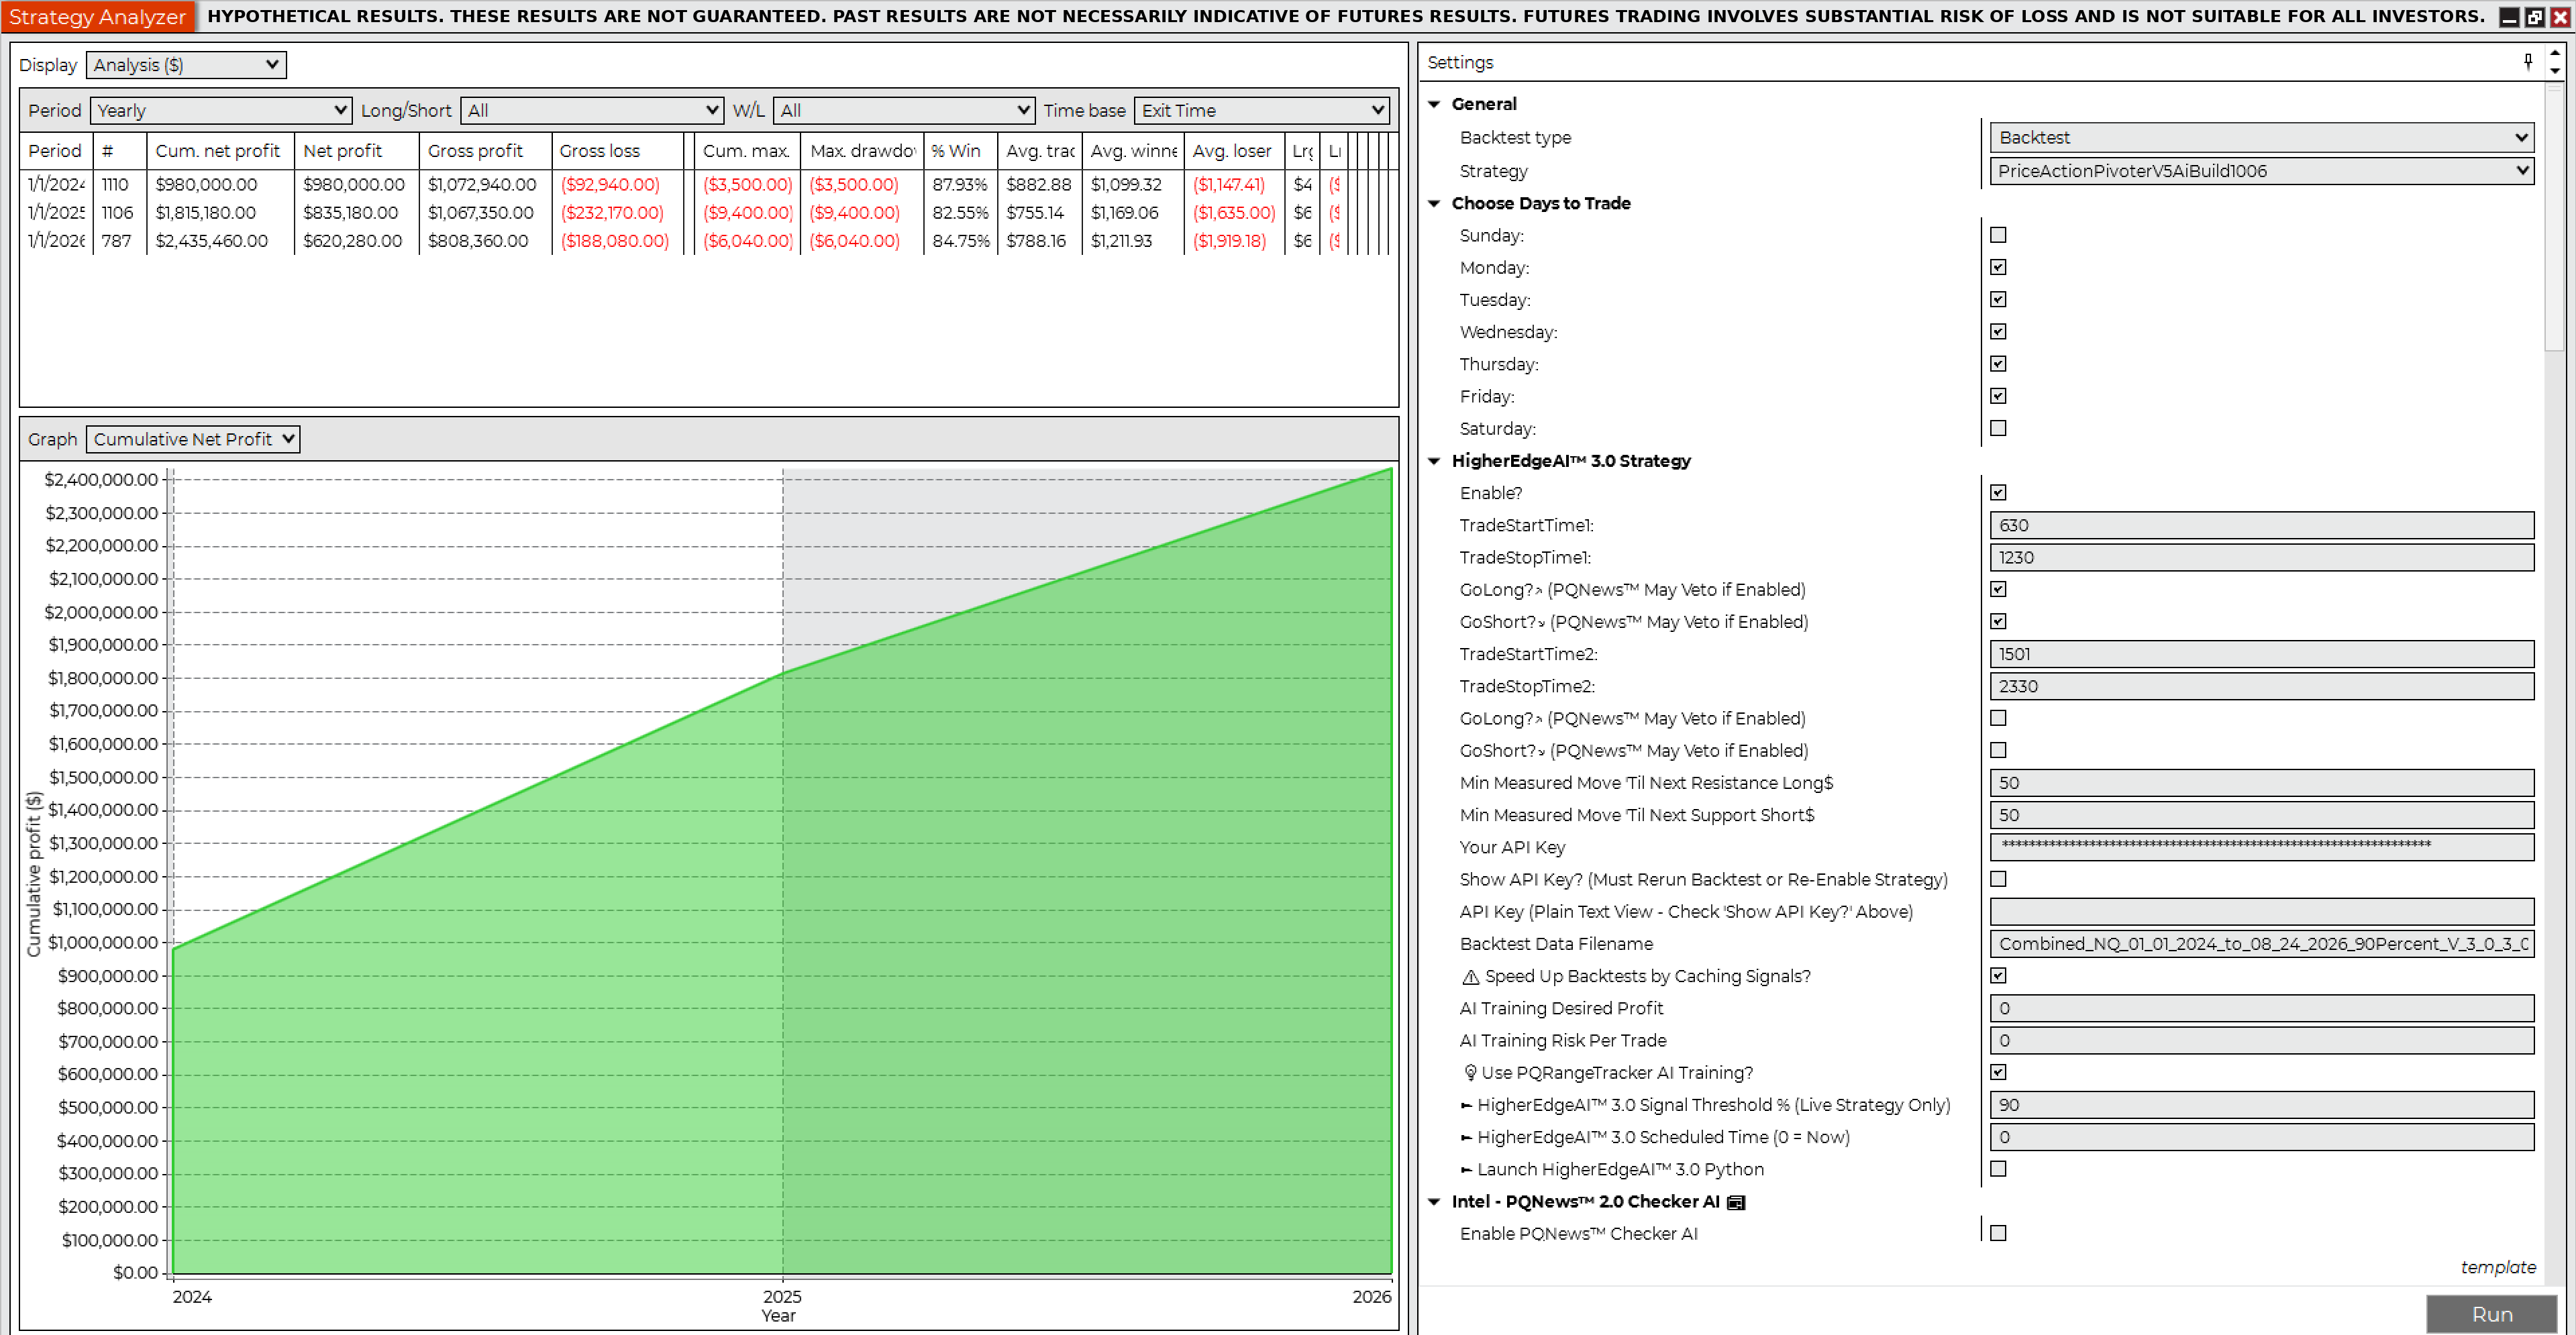
Hypothetical net profit$2,435,460.00

NinjaTrader Strategy Analyzer Summary, Backtest 8, NQ 2 Contracts 90%NinjaTrader Strategy Analyzer Monthly, Backtest 8, NQ 2 Contracts 90%NinjaTrader Strategy Analyzer Yearly, Backtest 8, NQ 2 Contracts 90%

NinjaTrader trade details, Backtest 8
Net profit$2,435,460.00
Gross profit$2,948,650.00
Gross loss($513,190.00)
Profit factor5.75
Max drawdown($9,400.00)
Number of trades3,003
Win rate85.11%
Winning trades2,556
Losing trades321
Start date1/1/2024
End date8/24/2026
Hours traded6:30 AM – 12:30 PM Pacific
Flatten everything12:59 PM Pacific
Sortino ratio1.00
Sharpe ratio2.25
Average time in market30.56 min
Max time to recover6.82 days
Longest flat period10.77 days
Average MAE$923.10
Average MFE$1,471.58
Market conditionAll, incl. economic news events
Contracts2
Slippage2 ticks
CommissionNot included; e.g. $10 × 3,003 = $30,030
While no backtest is 100% accurate and past results are not necessarily indicative of future results, the above hypothetical backtests provide valuable insights into how this innovative machine learning automated trading system uses real-time A.I. signals to identify trades and manage them throughout their full lifecycle, with granular user control over entries, exits, and risk management.

Lifetime license

Pay once. Own the Price Action Pivoter™ V5Ai Suite for life.

One payment, and it is yours: updates, training and support included, no renewal, no annual data bill. Need more contracts? Additional 15-contract lots are $5,000 each. The current offer date is shown under each price.

  • Official Price Action Pivoter V5Ai - Automated Trading System

  • Fully Automated Trading System for NinjaTrader?
  • Works with Interactive Brokers?
  • Real-Time AI Trading Automated Trading Strategy?
  • Includes Machine Learning Trading Engine?
  • Three Candidate ML Models Compete?
  • Cross-Index Market Context?
  • Adjustable AI Confidence? Threshold
  • Adaptive Model Reselection Every 12 Minutes?
  • Dual-Horizon Market Probability Prediction?
  • Multivariate AI Trading Bot?
  • News & ML-Based AI Automated Trading Software?
  • Best AI Trading App for Active Traders?
  • Does the AI Trading App Include News?
  • 100% Python-Based AI Trading Bot?
  • Directional LONG and SHORT Trade Vetoes?
  • Live News-Event/ Headline News Filtering?
  • Real-Time Price-Confirmed Veto Release Logic
  • Includes Real-Time Actionable News Intelligence?
  • Gemini-Assisted Real-Time Headline Analysis?
  • Geopolitical Real-Time Headline Monitoring?
  • Scheduled Economic-Release Awareness?
  • Shared Economic-Event Intelligence?
  • What is the Trading AI Bot Called?
  • What is the AI News Bot called?
  • NinjaTrader Strategy Automatically Reads Ai Signals?
  • Tactical Scaling (Up to 3 scale-in legs)
  • NinjaTrader Trading System Controls Python Terminals?
  • Includes MidPivotPointsPHL Indicator?
  • Trading Systems Direction?
  • Can I Trade Multiple Instruments Concurrently?
  • Can Choose Days/Times to Trade?
  • Finds Trade Setups in Bull & Bear Markets?
  • Good for Prop Traders?
  • Good for Independent Traders?
  • Session High-Watermark Protection?
  • Trailing Drawdown Protection?
  • Multiple Stops Where Most Protective Stop Wins?
  • Max # of Contracts?
  • Money Management Rules?
  • Risk Management Rules?
  • Trade Management Rules?
  • Early Windfall Profit Target
  • Near-Exit Profit Lock
  • Rapid Rejection Guard (RRG)
  • Most Protective Stop Wins
  • HigherEdgeAI™ Scheduled Launch
  • Price Action & A.I. Based?
  • Ability to Backtest?
  • Signal Caching for Fast Backtesting?
  • Makes Live Simulated Trades?
  • Makes Live Cash Trades?
  • Setup on Client\\\\\\\'s Computer?
  • Setup NinjaTrader & Data Connection?
  • Type of Support Offered?
  • Includes Updates?
  • Ability to Add Custom Strategies?
  • Good for Financial Advisor (FA) Accounts?
  • Payment Type?
  • Includes Training?
  • Offer Good Through:

Live sessions

Watch the Price Action Pivoter™ V5Ai Suite trade live, with HigherEdgeAI™ 3.0 and PQNews™ 2.0 running

Recorded during live sessions on ES and NQ. You see the signals arrive, the entries, the stop management and the PQNews™ veto as they happened, with no edits.


Who We Serve

Family Offices

Asset Managers

Professional Traders

“Wealth hastily gotten will dwindle, but those who gather little by little will increase it.” – Proverbs 13:11

Raffi was interviewed by Matthias Knab on Opalesque TV during the SALT Conference in 2019, where they discussed Raffi’s trading methodology and his work at the time as an E-mini S&P 500 (ES) specialist serving hedge fund portfolio managers. The interview pre-dates Pinnacle Quant’s retail focus, but the institutional foundation it reflects is what grounds every automated trading system Raffi has built since.

Request a Zoom Demo to See the Machine Learning & Gemini News-Powered Price Action Pivoter™ Trading Suite Live!

    Do You Currently Trade Futures (ES, MES, or others)? (required)
    YesNo

    Do You Currently Trade Stocks? (required)
    YesNo

    Do You Currently Own a NinjaTrader License? (required)
    YesNo

    Do You Currently Trade with Any Automated Trading Systems? (required)
    YesNo

    What day this week are you available for a Zoom demo?

    Please choose the best time-frame for the Zoom demo:

    Please choose the preferred method:
    Regular Phone CallZoom Screen Sharing Live Demonstration

    “

    “Discover for yourself if this unique automated trading suite is a good fit for the results you are accountable to deliver.”

    Raffi Sosikian, MBAPrincipal @ Pinnacle Quant, LLC, CTA

    Bloomberg® and Bloomberg Terminal® are registered trademarks of Bloomberg Finance L.P. Pinnacle Quant, LLC is not affiliated with, endorsed by, or sponsored by Bloomberg L.P. or any of its affiliates. Bloomberg Terminal pricing shown on this page is the published 2026 single-seat list price and add-on ranges as reported by multiple industry sources; Bloomberg L.P. does not publish a public price list and actual contract terms vary. NinjaTrader® is a registered trademark of NinjaTrader, LLC. Interactive Brokers® is a registered trademark of Interactive Brokers LLC. Google Gemini is a trademark of Google LLC. All other trademarks are the property of their respective owners.

    Price Action Pivoter™, HigherEdgeAI™, PQNews™ and PinnacleQuantRangeTracker™ are trademarks of Pinnacle Quant, LLC. Licensees remain solely responsible for their own registration, disclosure, suitability and trade-allocation obligations under CFTC, NFA, SEC and state rules.

    Powered by PinnacleQuant.com